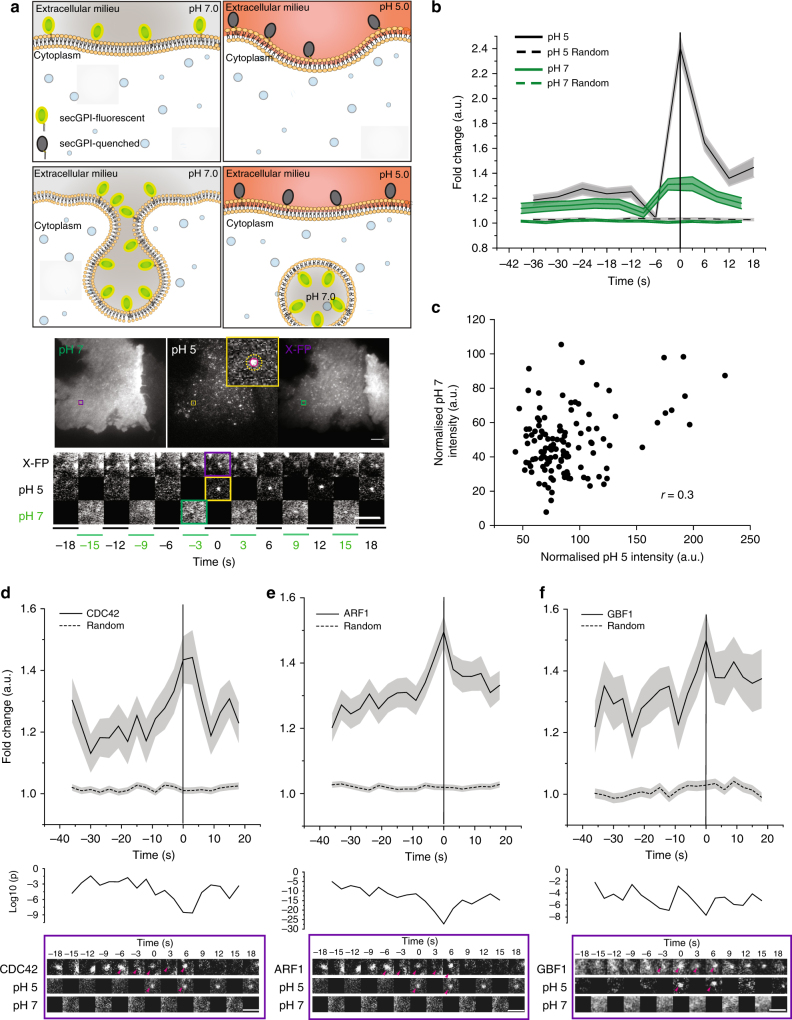
Fig. 1.
Identification of newly formed SecGFP-GPI endocytic vesicles using a pH pulsing assay. a Schematic (top panel) of the pH pulsing assay depicting the effect of pH on SecGFP-GPI fluorescence during endocytic vesicle budding. Note the fluorescence of SecGFP-GPI is retained at high pH (top and bottom left panel) or when exposed to low pH if sequestered in a newly formed endocytic vesicle (bottom right panel), and quenched only when exposed to low pH (top right panel). Sequential TIRF images of AGS cell co-expressing SecGFP-GPI and mCherry-ARF1 collected at pH 7, pH 5 and in the RFP channels (middle panel). Newly formed endocytic vesicles (inset) (identified as in Supplementary Figure 1c) are used to construct a single frame (yellow rectangle) of the montage depicted (bottom panel). b Average of the normalised fluorescence intensities of pH 5 and pH 7 traces at the site of newly formed SecGFP-GPI endocytic vesicles compared to their respective random traces constructed from 120 endocytic events (pH 5 and pH 7) and 3428 random spots, derived from 17 cells pooled from four independent experiments. c The graph shows the fold enrichment of fluorescence intensity over the local background of pH 5 vs. pH 7 at the time of formation of the endocytic vesicles (data from 1b). d–f Graphs show the average normalised fluorescence intensity vs. time traces for the recruitment of TagRFPt-CDC42 (d), mCherry-ARF1 (e) and mCherry-GBF1 (f) to the forming SecGFP-GPI endocytic sites, and its corresponding random intensity trace (n, Table 1). The random traces were derived from randomly assigned spots of the same radius as the endocytic regions, as detailed in S.I. Endocytic distribution at each time point was compared to the random distribution by Mann–Whitney U test, and the log10 (p) [log10 (0.05) is −1.3 and log10 (0.001) is −2.5] is plotted below each trace (d–f). Representative montages from the respective data sets are depicted below the graphs (d–f). Arrowheads indicate the newly formed endocytic vesicle. Error bars, s.e.m. (b, d–f). Scale bar, 1.5 µm (a, d–f)

