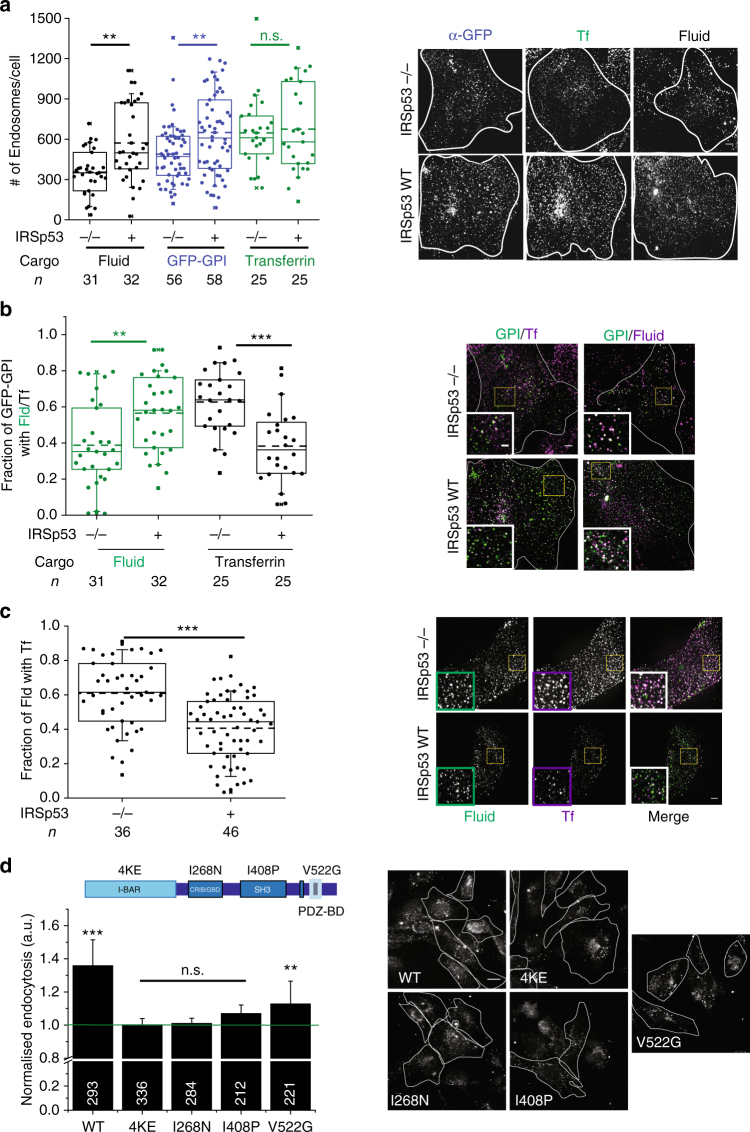
Fig. 4.
CG pathway is abolished in the absence of IRSp53. a The box plot shows the number of endosomes per cells (left) for endocytosed GFP-GPI (α-GFP Fab), fluid phase and TfR in IRSp53−/− and IRSp53 WT cells when pulsed for 2 min along with representative images (right). Data were pooled from two independent experiments and the number of cells indicated below the graph. b Plot (left) shows quantification of the fraction of GFP-GPI endocytic vesicles containing fluid phase or Tf. Images (right) show representative single confocal slices of a 2-min pulse of α-GFP Fab (green)/TMR-Dextran (magenta) and α-GFP Fab (green)/A568-Tf (magenta) in IRSp53−/− (top row) and IRSp53WT (bottom row) cells. The inset depicts magnified views of the indicated region; single-channel images are in panel 4a. Data were pooled from two independent experiments and the number of cells is indicated below the graph. c Plot (left) showing quantification of the fraction of 1-min fluid-phase endocytic vesicles containing Tf. Images show representative single confocal slices of a 1-min pulse of TMR-Dextran (green) and A647-Tf (magenta) in IRSp53−/− (top row) and IRSp53WT (bottom row) cells. Inset depicts magnified views of the indicated region. Data were pooled from two independent experiments and the number of cells indicated below the graph. d Histogram (left) shows 5-min uptake of fluid phase in IRSp53−/− MEFs transduced with virus expressing GFP-IRSp53 WT, GFP-IRSp53 4KE, GFP-IRSp53 I268N, GFP-IRSp53 I408P and GFP-IRSp53 V522G, normalised to that in IRSp53−/− MEFs, along with representative images (right). Data were pooled from two independent experiments and the number of cells indicated in figure except for IRSp53−/− (381). p value <0.01 (*) and 0.001(**) by Mann–Whitney U test (a–d). Scale bar, 20 µm (d), 5 µm (a–c), respectively. Error bars (d) represent s.d.

