Fig. 5.
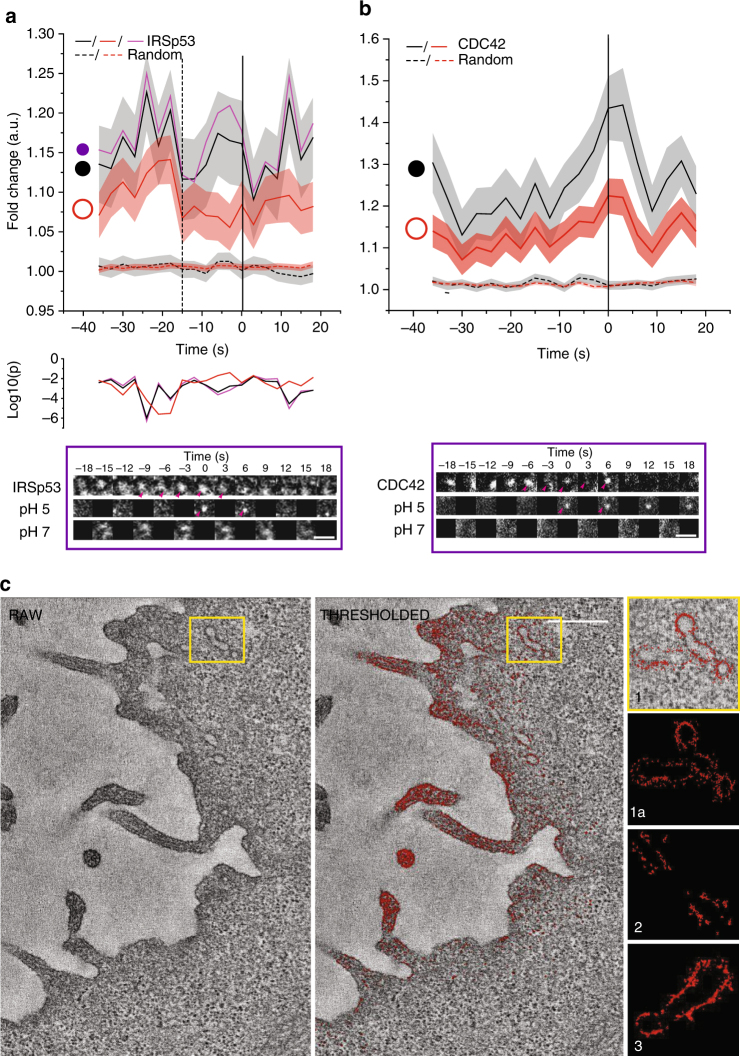
IRSp53 is recruited to forming CG endosomes. a Graphs show the average normalised fluorescence intensity vs. time traces for the recruitment of three different regions [circles, violet, r = 170 nm and black (r = 250 nm) and annulus, orange (r = 250–420 nm)] for the recruitment of IRSp53-mCherry to the forming SecGFP-GPI endocytic sites and its corresponding random intensity trace (n, Table 1). b Graphs show the average normalised fluorescence intensity vs. time traces for the recruitment of TagRFPt-CDC42 to the forming SecGFP-GPI endocytic sites and its corresponding random intensity trace to two different regions [circle, black, r = 250 nm; and annulus, orange (r = 250–420 nm)]. Error bars, (a–b) represent s.e.m. (n, Table 1). The random traces were derived from randomly assigned spots of the same radius as the endocytic regions, as detailed in S.I. Endocytic distribution at each time point was compared to the random distribution (a) by Mann–Whitney U test and the log10 (p) is plotted below each trace [log10 (0.05) is −1.3 and log10 (0.001) is −2.5]. Representative montages are depicted below the graphs (a–b). Arrowheads indicate the newly formed endocytic vesicle. c Electron micrographs of AGS cells co-transfected-GFP-IRSp53 and GFP-binding protein coupled to Apex (GBP-Apex). The DAB reaction was performed and the cells were processed for electron tomography. A single section of the original tomogram (left) and density-based thresholded of the same plane (middle) reveal electron dense structures containing IRSp53 at membrane surfaces. The whole of PM of the tomographic volume was rendered and different examples of enlarged tubular regions of interest show GFP-IRSp53 recruitment patterns (right). Scale bar, 1.5 µm (a–b) and 0.5 µm (c), respectively

