Fig. 7.
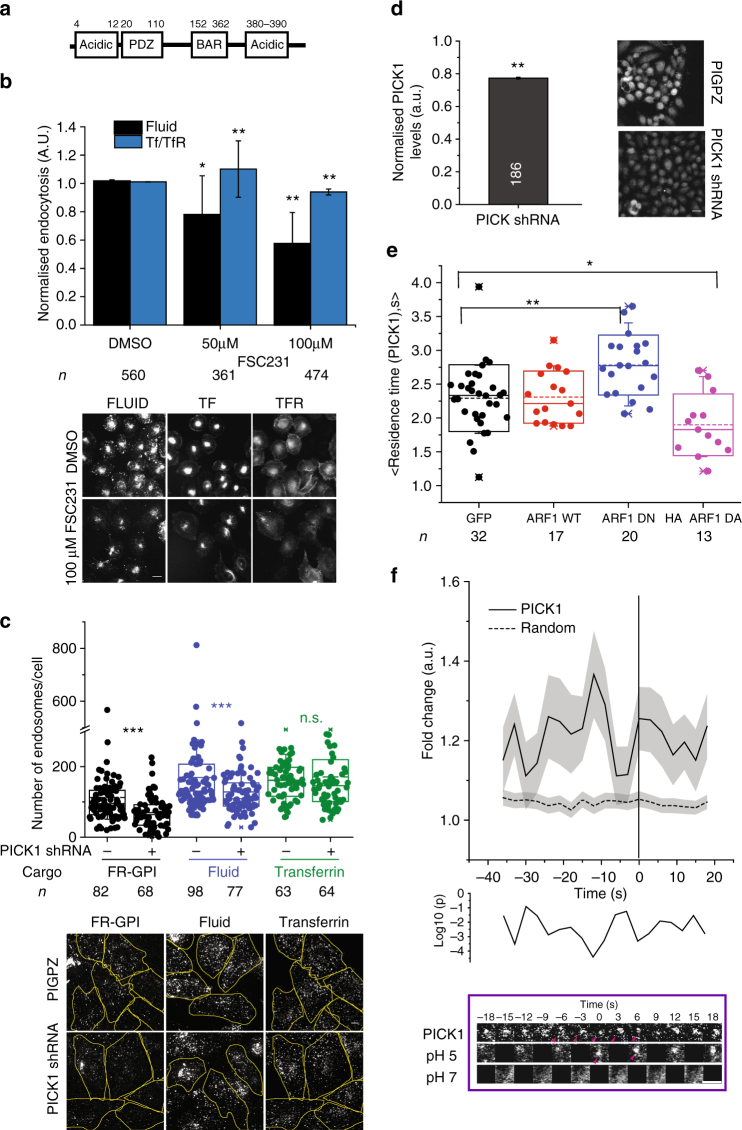
PICK1 is involved in CG endocytosis and is negatively regulated by ARF1. a Schematic depicts domain organisation of PICK1. b Histograms (top) show quantification of fluid-phase and TfR uptake in AGS cells treated with DMSO alone (0 µM) or the indicated concentrations of PICK1 inhibitor, FSC231, normalised to DMSO-treated controls, along with its representative images (below). Data were pooled from two independent experiments with the cell numbers shown below the graph. c Box plot (top) shows the number of endosomes per cells for FR-GPI (Cy3-Mov18), fluid phase and TfR in scrambled (PIGPZ) and PICK1 shRNA-infected AGS cells when pulsed for 2 min along with representative images (bottom). Data are pooled from two independent experiments and the number of cells indicated below the graph. d Histogram (left) shows normalised PICK1 levels measured by immunostaining in PICK1 shRNA-infected AGS cells along with representative images (right). Data were pooled from two independent experiments with the cell numbers indicated in the figure except for PIGPZ (292). e Box plot (top) shows the residence time of TagRFPt-PICK1 spots at the TIRF plane (see Methods), averaged in an individual cell expressing either GFP, GFP-ARF1 WT, GFP-ARF1 DN or HA-ARF1 DA. The data are pooled from two independent experiments with cell number indicated below the graph. f The graph shows the average normalised fluorescence intensity vs. time trace for the recruitment of TagRFPt-PICK1 to the forming SecGFP-GPI endocytic sites and its corresponding random intensity trace (n, Table 1). The random traces were derived from randomly assigned spots of the same radius as the endocytic regions, as detailed in S.I. Endocytic distribution at each time point was compared to the random distribution by Mann–Whitney U test and the log10 (p) [log10 (0.05) is −1.3 and log10 (0.001) is −2.5] is plotted below. Representative montage is depicted below. Arrowheads indicate the newly formed endocytic vesicle. Error bars represent s.e.m. (f) and s.d. (b, d). p value <0.01 (*), 0.001(**) and 0.0001 (***) by Mann–Whitney U test (b–e). Scale bar, 1.5 µm (f), 20 µm (b, d) and 5 µm (c)

