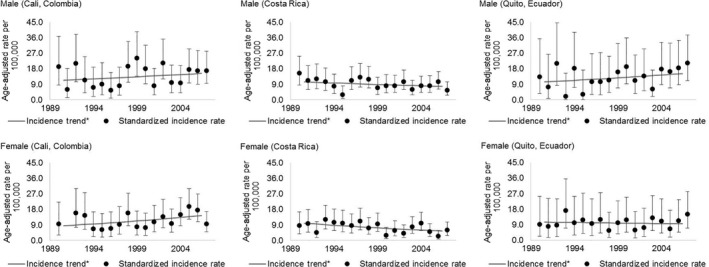
Figure 1.

Multiple myeloma age‐adjusted incidence rates (95% confidence interval) for sex, age above 60 years, for Cali (Colombia), Costa Rica, and Quito (Ecuador), for the period 1990–2007. 95% CI: 95% confidence interval. The gray line represents trends over the period.
