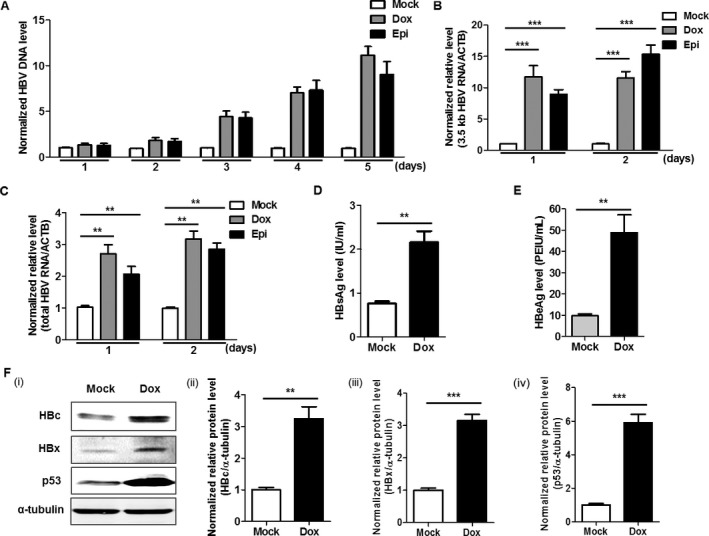
Figure 1.

Doxorubicin and epirubicin promote HBV replication in HepG2.2.15 cells. (A) HepG2.2.15 cells were treated with either 1 μmol/L doxorubicin (Dox) or epirubicin (Epi) for 1 h. The normalized levels of HBV DNA in the culture supernatant at different times (1, 2, 3, 4, and 5 days) post‐treatment were measured by quantitative PCR (qPCR). HepG2.2.15 cells were treated with either 1 μmol/L Dox or Epi for 1 h, 24, or 48 h later, and the normalized relative levels of 3.5 kb (B) and total HBV RNA (C) in HepG2.2.15 cells were quantified by quantitative RT‐PCR (qRT‐PCR). The mRNA of the β‐actin gene (ACTB) was used as an internal control. The levels of HBsAg (D) and HBeAg (E) in the culture supernatant of HepG2.2.15 cells treated with 1 μmol/L Dox for 1 h were measured by a time‐resolved fluoroimmunoassay at 48 h post‐Dox treatment. (F) The protein levels of HBc (HBc) and HBxAg (HBx) in HepG2.2.15 cells treated with 1 μmol/L Dox for 1 h were measured by Western blot at 48 h post‐Dox treatment. (i). The right figures were the statistical graphs of the HBc (ii), HBx (iii), and p53 (iv) protein levels detected by Western blot, which was analyzed by ImageJ software (NIH, Bethesda, MD), at least in triplicate. The p53 protein was used as a positive control. The α‐tubulin was used as an internal control.
