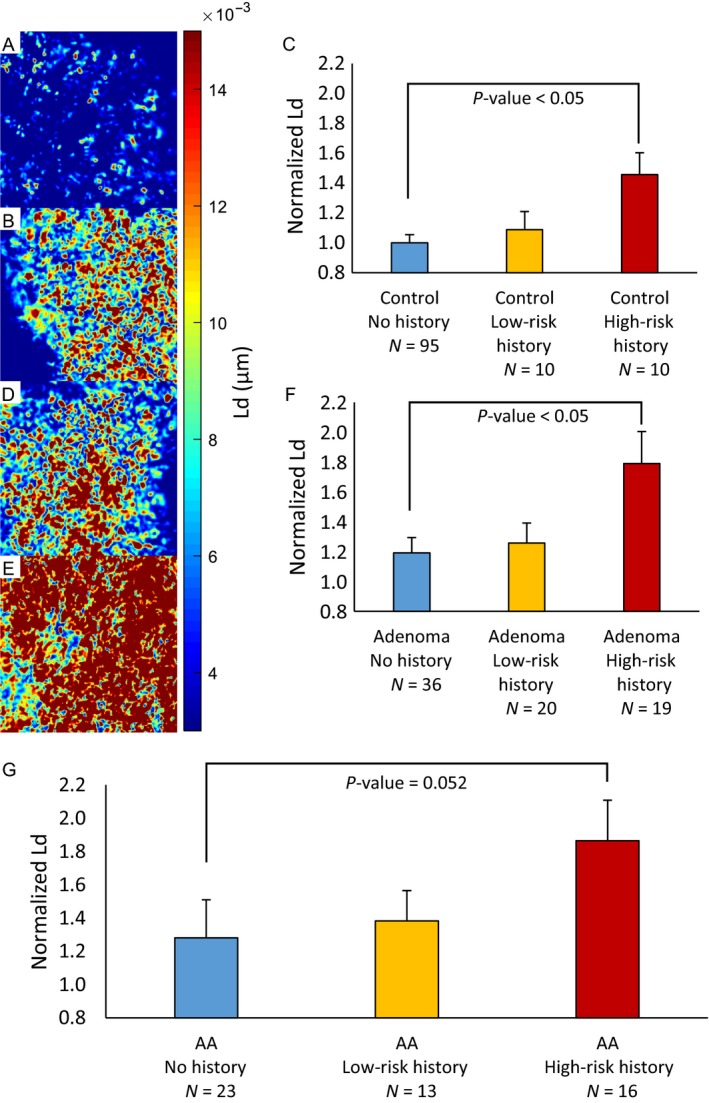
Figure 2.

Partial wave spectroscopic (PWS) L d map from tissue bed of rectal colonocytes from patients (A) Control No History, (B) Control High‐Risk History, (D) Adenoma No History, and (E) Adenoma High‐Risk History. (C) Within the control group, L d increases as the patient's level of history risk increases (Control No History vs. Control High‐Risk History [N = 95 vs. 10, percent difference = 37.2%, P = 0.013, effect size = −0.866]). (F) Within the adenoma group, L d increases as the patient's level of history risk increases (Adenoma No History vs. Adenoma High‐Risk History [N = 36 vs. 19, percent difference = 40.2%, P = 0.019, effect size = −0.807]). (G) There is a large difference between advanced adenoma patients (the most clinically significant, highest risk category) with high‐risk history and no history (N = 23 vs. 16, percent difference = 37.1%, P = 0.052, effect size = −0.698). These results show that PWS is sensitive to the history of a patient's colon, which suggests that although these patients have clinically similar colons as determined by colonoscopy, patients with high‐risk history actually have elevated and mutationally active field carcinogenesis that could lead to future colorectal cancer.
