Figure 2.

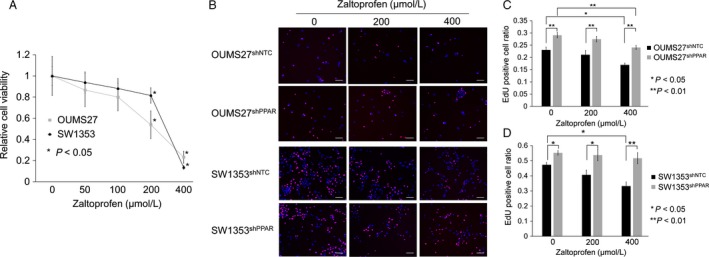
(A) Effects of zaltoprofen on the viability of OUMS27 and SW1353 cells. The cells were treated with or without zaltoprofen for 72 h, followed by WST assay. Asterisks denote a statistically significant difference (*P < 0.05) between cells with and without treatment of zaltoprofen (200 or 400 μmol/L). (B) Representative photos of 5‐ethynyl‐2′‐deoxyuridine (EdU) proliferation assay in PPAR γ knockdown cell lines, OUMS27sh PPAR and SW1353sh PPAR, and the control cell lines, OUMS27sh NTC and SW1353sh NTC with or without the treatment of zaltoprofen for 24 h. Scale bar = 100 μm. (C, D) The EdU‐positive cell ratio [EdU‐positive nuclei (red)/Hoechst 33342‐positive nuclei (blue)] in OUMS27 (C) and SW1353 cells (D). Values represented as the mean ± SEM. Asterisks denote a statistically significant difference (*P < 0.05 and **P < 0.01).
