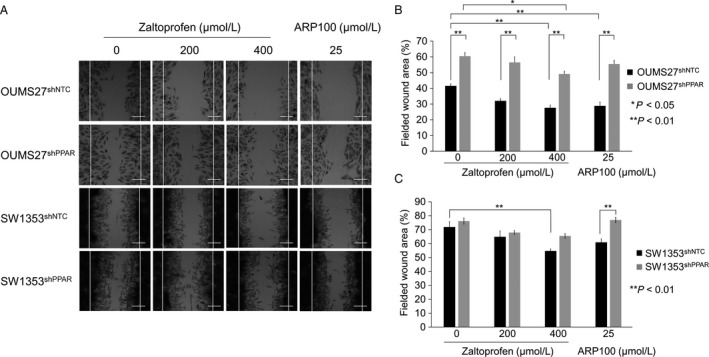
Figure 3.

(A) Cell migration assay was carried out using PPAR γ knockdown cell lines, OUMS27sh PPAR and SW1353sh PPAR, and the control cell lines, OUMS27sh NTC and SW1353sh NTC with or without the treatment of zaltoprofen. A selective inhibitor of MMP2, ARP100, was used at 25 μmol/L. Scale bar = 100 μm. (B, C) The fielded wound area (%) was calculated in OUMS27 (B) and SW1353 cells (C). Values represented as the mean ± SEM. Asterisks denote a statistically significant difference (*P < 0.05 and **P < 0.01).
