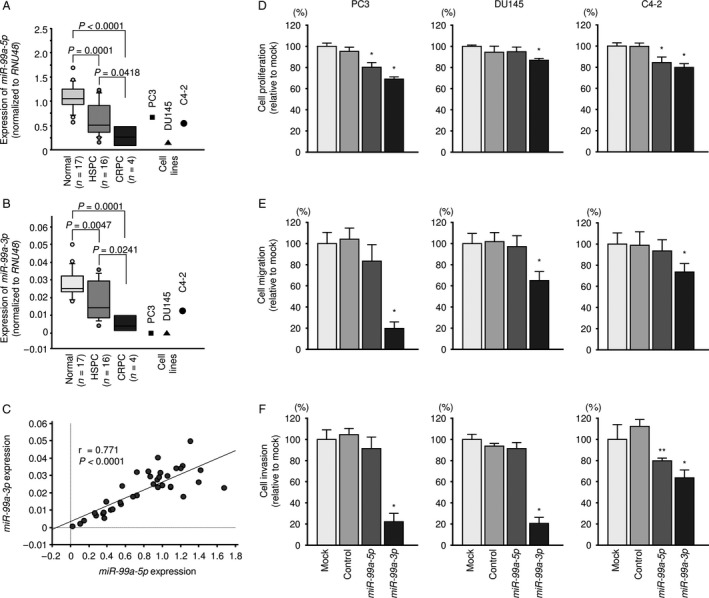
Figure 1.

Expression of miR‐99a‐5p/3p in clinical prostate specimens and functional analysis of miR‐99a‐5p/3p in PCa cell lines. (A) Expression levels of miR‐99a‐5p in PCa clinical specimens and cell lines determined using qRT‐PCR. RNU48 was used as an internal control. (B) Expression levels of miR‐99a‐3p in PCa clinical specimens and cell lines. (C) Correlations among the relative expression levels of miR‐99a‐5p and miR‐99a‐3p. (D‐F) Cell proliferation, migration, and invasion assays in cells transfected with miR‐99a‐5p/3p. *P < 0.0001 and **P < 0.001.
