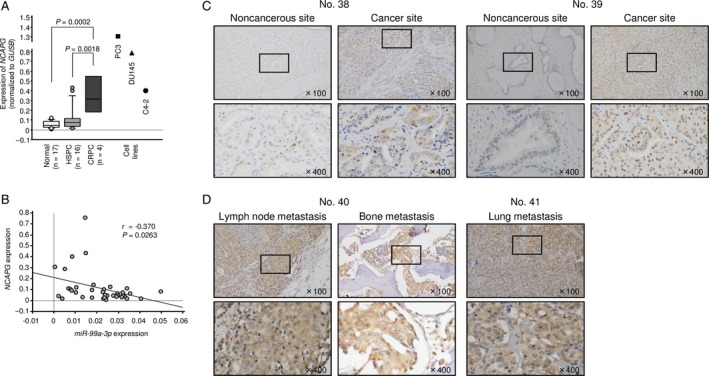
Figure 5.

Expression of NCAPG in clinical PCa specimens. (A) Expression levels of NCAPG in PCa clinical specimens and cell lines. GUSB was used as an internal control. (B) The negative correlation between miR‐99a‐3p and NCAPG. (C) Immunochemical staining of NCAPG in HSPC specimens. (D) Immunochemical staining of NCAPG in mCRPC specimens.
