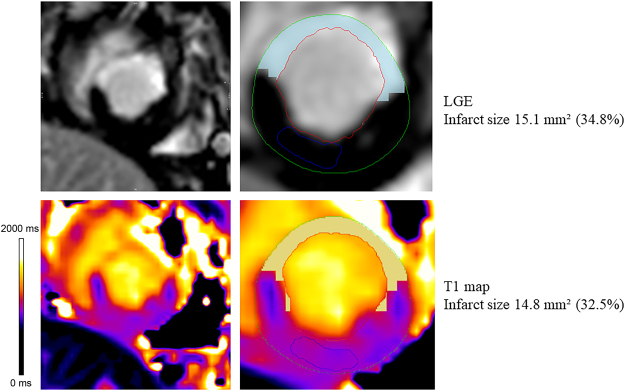
Figure 2.
Infarct size analysis in a swine MI model at 1.5 T. Legend: Infarcted myocardium is identified on both images using the mean + 5 SD criterion for the LGE image and mean + 3 SD criterion for the T1 map (highlighted in blue and yellow pixels on the LGE image and T1 map) in respect to a reference region of interest drawn in the remote myocardium (blue contours). The infarcted area accounts for 32.5% and 34.8% of the entire myocardium of the slice on the T1 map and the LGE image respectively.

