

Abstract
The nuclear factor I (NFI) family members, especially NFIA and NFIB, play essential roles in cancers. The roles of NFIA and NFIB in esophageal squamous cell carcinoma (ESCC) and esophagogastric junction adenocarcinoma (EJA) remain poorly known. This study aimed to determine the expression of NFIA and NFIB in ESCC and EJA and elucidate their prognostic significance. The expression of NFIA and NFIB was examined in 163 ESCC samples and 26 EJA samples by immunohistochemistry. The results showed that high NFIA expression correlated significantly with poor differentiation, lymph node metastasis, and advanced TNM stage in patients with ESCC. High NFIB expression only correlated with poor differentiation in patients with ESCC. Survival analysis showed that NFIA but not NFIB associated with short overall survival (OS) and disease‐free survival (DFS) of patients with ESCC. On the other hand, high NFIB expression correlated with lymph node metastasis, advanced TNM stage, and short OS and DFS in patients with EJA. Finally, multivariate analysis demonstrated that high NFIA expression was an independent prognostic factor for ESCC. Taken together, these results demonstrated that NFIA and NFIB could serve as prognostic indicators for ESCC and EJA, respectively.
Keywords: Esophageal squamous cell carcinoma, esophagogastric junction adenocarcinoma, NFIA, NFIB, prognosis
Introduction
Esophageal squamous carcinoma (ESCC) accounts for more than 90% of esophageal cancer (EC), which is one of the most prevalent cancers in Africa and Asia 1. Generally, ESCC is diagnosed at late stages and the prognosis is poor despite the application of multidisciplinary therapy. Most patients die within 1 year after diagnosis, and the five‐year survival rate is only 8% to 20% 2. Esophagogastric junction adenocarcinoma (EJA) is defined as the carcinoma that across the esophagogastric junction line, including both distal esophageal adenocarcinoma and proximal gastric cancer 3. Accumulating studies reveal that EJA is different from gastric and esophageal adenocarcinoma in molecular features, pathological evolution, and clinical behavior 4. The incidence of EJA has risen fast in North America, Europe, and East Asia over the last two decades 5. The five‐year survival rate of EJA is as low as 10–15% 6. Revealing novel molecular markers is urgently needed to improve the prognosis of patients with ESCC and EJA.
The nuclear factor I (NFI) family, initially found to function in adenoviral DNA replication, consists of four genes (NFIA, NFIB, NFIC, and NFIX). These genes encode nuclear factors that bind to TTGGC(N5)GCCAA sequence as homo‐ or heterodimers to activate or suppress gene transcription depending on the cellular context and regulatory region 7. The NFIs were then demonstrated to play crucial roles in the development of many organ systems such as the central nervous system and lung 8. Recent studies revealed that NFIs, especially NFIA and NFIB, also function in the development or progression of cancers 7. In contrast to the clear role of NFIA as a tumor‐promoting gene in glioma 9 and esophageal carcinoma 10, the role of NFIB in carcinogenesis or progression is context‐dependent 11. On the one hand, NFIB acts as a tumor‐promoting gene in small‐cell lung cancer (SCLC) 12, 13, 14, 15, melanoma 16, breast cancer 17, 18, and colon cancer 19. On the other hand, NFIB acts as a tumor suppressor in other cancers including osteosarcoma 20, cutaneous squamous cell carcinoma 21, and non–small‐cell lung cancer (NSCLC) 22. However, the expression and clinicopathological value of NFIA and NFIB in ESCC and EJA are yet to be explored.
This study aimed to elucidate the prognostic value of NFIA and NFIB in 163 patients with ESCC and 26 patients with EJA using immunohistochemistry. The results showed that high NFIA expression correlated with poor differentiation, lymph node metastasis, and short overall survival (OS) and disease‐free survival (DFS) in patients with ESCC. High NFIB but not NFIA expression correlated with poor differentiation, lymph node metastasis, and short OS and DFS time in patients with EJA. These results demonstrated the distinct roles of NFIA and NFIB in esophageal cancer.
Materials and Methods
Patients and primary tissue samples
Esophageal squamous cell carcinoma (n = 163) and esophagogastric junction adenocarcinoma (n = 26) tissues were obtained from 189 patients who underwent esophagectomy resection with lymph node dissection during the period from 2012 to 2015 at the PLA General Hospital and the 309th Hospital of PLA. The cancer tissues and corresponding paracancerous tissues were applied to produce human tissue microarray (3 cores/tissue). The criteria for selecting patients were as follows: (1) did not have synchronous tumors or multiple metachronous tumors; and (2) did not receive preoperative chemotherapy or radiation therapy. The samples were embedded in paraffin after 24 h of formalin fixation. The diagnoses of esophageal squamous cell carcinoma and esophagogastric junction adenocarcinoma were made independently by at least two pathologists. Staging was principally based on the eighth staging primer of esophagus and esophagogastric junction cancer 23. All the patients gave informed consent (written) before research. This study was carried out in accordance with the principles of the Helsinki Declaration and approved by the Ethical Committee of the PLA General Hospital.
Immunohistochemistry
Immunohistochemistry was performed as previously described 24. Briefly, after being deparaffinized and rehydrated, the sections were boiled in 10 mmol/L citrate buffer (pH 6.0) for 15 min in a microwave oven. The sections were then incubated with anti‐NFIA (1:100, catalog no. GR195242‐1; Abcam, Cambridge, MA) or NFIB antibodies (1:100, catalog no. GR229339‐13; Abcam) overnight at 4°C. Sections were washed for one hour in TBST and then incubated with a secondary antibody (DAKO, Denmark) at a dilution of 1:100 in TBST. Finally, the sections were visualized using diaminobenzidine solution (DAKO Denmark). Sections without incubation with primary antibody served as negative controls.
Evaluation of immunostaining results
The intensity of staining (brown color) was semiquantitatively scored as follows: 1, weak; 2, medium; 3, strong; and 4, very strong. The percentage of maximally stained tumor cells in each section was recorded (0, <5%; 1, 5–30%; 2, 30–50%; 3, >50%). The intensity of the staining multiplied by the percentage of positive cells yields the combined score of a sample. High expression of NFIA/NFIB was defined as a combined score for the intensity and area of staining that was larger than 3, which is determined by the X‐tile software (Rimm Lab, Yale University, New Haven, CT). The results were verified by two pathologists independently.
Statistical analyses
Kolmogorov–Smirnov test was used to estimate the normality of distributions. Statistical significance was analyzed with SPSS 18.0 software (SPSS, Chicago, IL). The correlation between NFIA or NFIB and clinicopathological features was analyzed by chi‐square test. Differences in noncategorical variables between subgroups were tested with the nonparametric Mann–Whitney U‐test. The OS and DFS were calculated from the date of surgery to the date of the final follow‐up or event using the Kaplan–Meier method. The survival curve was assessed by the log‐rank test. Univariate Cox analysis was applied to evaluate the association between the clinicopathological parameters, NFIA/NFIB expression, and patients’ survival. Multivariate Cox proportional hazards regression model was further used to investigate the independent prognostic factors. P values less than 0.05 were considered statistically significant.
Results
High NFIA expression correlated with lymph node metastasis and poor differentiation in ESCC
The expression of NFIA and NFIB was firstly evaluated in ESCC tissues from 163 patients, including 135 males and 28 females. The average age at diagnosis was 60.9. As shown in Figure 1A, NFIA and NFIB were expressed if any only in basal cells of normal esophageal epithelia, mainly located in the nucleus, while in ESCC tissues, NFIA was highly expressed in cancer cells, located in both the nucleus and cytoplasm. High expression of NFIA was found in cancerous tissues from 104 patients (63.8%). The expression of both NFIA and NFIB was significantly higher than that in normal esophageal epithelia (Fig. 1B). Chi‐square test revealed that high NFIA expression significantly correlated with poor differentiation (P = 0.046), lymph node metastasis (P = 0.021), and advanced TNM stage (P = 0.045) in ESCC, while high NFIB expression only correlated with poor differentiation degree (P = 0.038) (Table 1). NFIA expression was higher in cancer tissues with lymph node metastasis than in those without lymph node metastasis (Fig. 1C). The expression of NFIA and NFIB in cancer tissues with different differentiation degree is shown in Figure 2A and B, respectively. It is obvious that both NFIA and NFIB were highly expressed in poorly differentiated ESCC. Taken together, these results revealed that NFIA was highly expressed in ESCC tissues and high NFIA expression correlated with poor differentiation, lymph node metastasis, and advanced TNM stage in ESCC.
Figure 1.
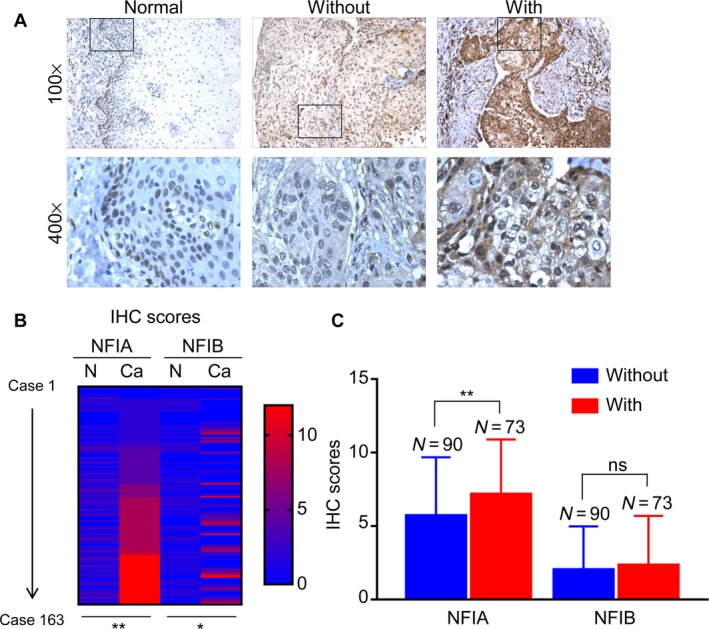
High NFIA expression correlates with lymph node metastasis in esophageal squamous cell carcinoma (ESCC). (A) Representative images showing the expression of NFIA in normal esophageal epithelia and ESCC tissues with or without lymph node metastasis. (B) Heat map showing the IHC scores of NFIA and NFIB in ESCC tissues and corresponding normal esophageal epithelia. (C) IHC scores of NFIA in ESCC tissues with or without lymph node metastasis. *P < 0.05; **P < 0.01.
Table 1.
Correlation between NFIA/NFIB expression and clinicopathological features in cancer tissues from 163 patients with esophageal squamous cell carcinoma
| Clinicopathologic features | No. of patients (%) | NFIA expression status | P value | NFIB expression status | P value | ||
|---|---|---|---|---|---|---|---|
| Low (n = 59) No. of patients (%) | High (n = 104) No. of patients (%) | Low (n = 110) No. of patients (%) | High (n = 53) No. of patients (%) | ||||
| Gender | |||||||
| Male | 135 (82.8) | 49 (36.3) | 86 (63.7) | 1.000 | 91 (67.4) | 44 (32.6) | 1.000 |
| Female | 28 (17.2) | 10 (35.7) | 18 (64.3) | 19 (67.9) | 9 (32.1) | ||
| Age | |||||||
| ≤60 | 74 (45.4) | 27 (36.5) | 47 (63.5) | 1.000 | 49 (66.2) | 25 (33.8) | 0.867 |
| >60 | 89 (54.6) | 32 (36.0) | 57 (64.0) | 61 (68.5) | 28 (31.5) | ||
| Tumor size (cm) | |||||||
| ≤4.0 | 99 (60.7) | 37 (37.4) | 62 (62.6) | 0.741 | 68 (68.7) | 31 (31.3) | 0.733 |
| >4.0 | 64 (39.3) | 22 (34.4) | 42 (65.6) | 42 (65.6) | 22 (34.4) | ||
| Differentiation degree | |||||||
| Well | 40 (24.5) | 21 (52.5) | 19 (47.5) | 0.046 | 33 (82.5) | 7 (17.5) | 0.038 |
| Moderate | 66 (40.5) | 21 (31.8) | 45 (68.2) | 44 (66.7) | 22 (33.3) | ||
| Poor | 57 (35.0) | 17 (29.8) | 40 (70.2) | 33 (57.9) | 24 (42.1) | ||
| T‐stage | |||||||
| T1+T2 | 45 (27.6) | 17 (37.8) | 28 (62.2) | 0.856 | 27 (60.0) | 18 (40.0) | 0.262 |
| T3+T4 | 118 (72.4) | 42 (35.6) | 76 (64.4) | 83 (70.3) | 35 (29.7) | ||
| Lymph node metastasis | |||||||
| Negative | 90 (55.2) | 40 (44.4) | 50 (55.6) | 0.021 | 63 (70.0) | 27 (30.0) | 0.503 |
| Positive | 73 (44.8) | 19 (26.0) | 54 (74.0) | 47 (64.4) | 26 (35.6) | ||
| Distant metastasis | |||||||
| Negative | 163 (100.0) | 59 (36.2) | 104 (63.8) | na | 110 (67.5) | 53 (32.5) | na |
| Positive | 0 (0) | 0 (0) | 0 (0) | 0 (0) | 0 (0) | ||
| TNM stage | |||||||
| I | 12 (7.4) | 2 (16.7) | 10 (83.3) | 0.045 | 6 (50.0) | 6 (50.0) | 0.363 |
| II | 91 (56.4) | 40 (44.0) | 51 (56.0) | 64 (70.3) | 27 (29.7) | ||
| III | 60 (36.8) | 17 (28.3) | 43 (71.7) | 40 (66.7) | 20 (33.3) | ||
Chi‐square test was used to evaluate the correlation between NFIA/NFIB expression and clinicopathological features. The bold values indicated that the P value was smaller than 0.05.
Figure 2.
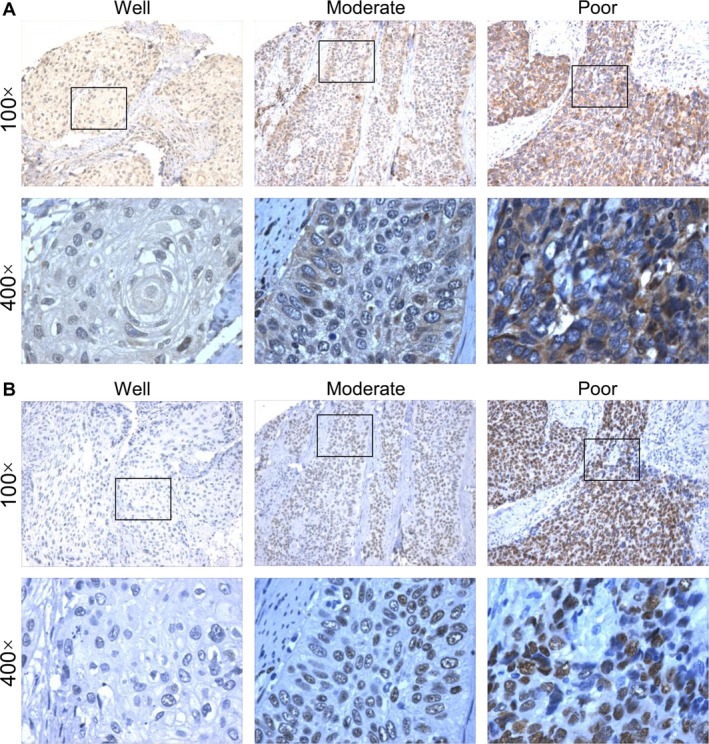
High NFIA expression correlates with poor differentiation in esophageal squamous cell carcinoma (ESCC). (A) Representative images showing the expression of NFIA in ESCC tissues with good, moderate, or poor differentiation. (B) Representative images showing the expression of NFIB in ESCC tissues with good, moderate, or poor differentiation.
High NFIA expression is an independent predictor of poor prognosis in patients with ESCC
We obtained follow‐up information from 130 patients with ESCC, including 111 males and 19 females. The mean follow‐up time was 27.9 months. The Kaplan–Meier analysis illustrated that high NFIA expression correlated with short OS (Fig. 3A; P < 0.001) or DFS (Fig. 3B; P < 0.001) time in patients with ESCC, but NFIB did not correlate with OS or DFS time (Fig. 3C and D). Univariate Cox regression analysis showed that high NFIA expression (hazard ratio (HR) = 3.031, 95% confidence interval (CI) = 1.754–5.239, P < 0.001), tumor size (HR = 1.781, 95% CI = 1.131–2.805, P = 0.013), T‐stage (HR = 2.334, 95% CI = 1.304–4.179, P = 0.004), and lymph node metastasis (HR = 3.660, 95% CI = 2.661–5.925, P < 0.001) were prognostic risk factors for OS (Table 2). Besides, high NFIA expression (HR = 3.044, 95% CI = 1.697–5.457, P < 0.001), T‐stage (HR = 2.156, 95% CI = 1.173–3.963, P = 0.013), and lymph node metastasis (HR = 4.116, 95% CI = 2.442–6.936, P < 0.001) were prognostic risk factors for DFS (Table 2). Multivariate Cox proportional hazards regression analysis revealed that high NFIA expression (HR = 3.450, 95% CI = 1.908–6.240, P < 0.001), lymph node metastasis (HR = 2.636, 95% CI = 1.565–4.439, P < 0.001), and T‐stage (HR = 2.272, 95% CI = 1.224–4.217, P = 0.009) were independent risk factors for OS in ESCC (Table 3). High NFIA expression (HR = 3.388, 95% CI = 1.801–6.371, P < 0.001), lymph node metastasis (HR = 3.628, 95% CI = 2.020–6.517, P < 0.001), and T‐stage (HR = 2.228, 95% CI = 1.166–4.256, P = 0.015) were also independent risk factors for DFS in ESCC (Table 3). These results demonstrated that high NFIA expression is an independent prognostic factor in ESCC.
Figure 3.
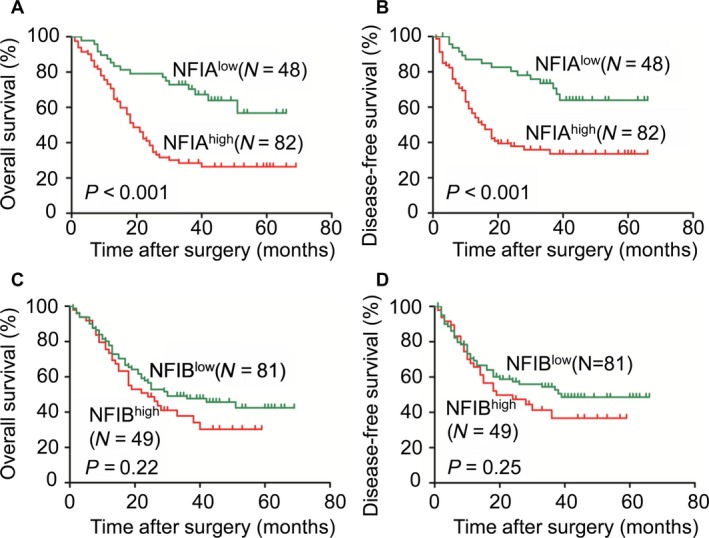
High NFIA expression is a predictor of poor prognosis in patients with esophageal squamous cell carcinoma (ESCC). (A and B) The Kaplan–Meier survival analysis showing that ESCC patients with high NFIA expression tend to have a shorter OS (A) or DFS (B) time. (C and D) The Kaplan–Meier survival analysis showing that NFIB expression was correlated with neither OS (C) nor DFS (D) time.
Table 2.
Univariate Cox regression analysis of the risk factors in esophageal squamous cell carcinoma
| Clinicopathologic features | OS | DFS | ||||
|---|---|---|---|---|---|---|
| HR | 95% CI | P value | HR | 95% CI | P value | |
| Gender (female/male) | 0.603 | 0.290–1.256 | 0.177 | 0.697 | 0.332–1.463 | 0.340 |
| Age (>62/≤62) | 1.177 | 0.743–1.864 | 0.489 | 1.193 | 0.728–1.955 | 0.483 |
| Tumor size (cm) (>4.3/≤4.3) | 1.781 | 1.131–2.805 | 0.013 | 1.435 | 0.880–2.340 | 0.148 |
| Differentiation degree (Well/Moderate/Poor) | 1.027 | 0.763–1.384 | 0.860 | 0.934 | 0.678–1.285 | 0.675 |
| T‐stage (T3 + T4/T1 + T2) | 2.334 | 1.304–4.179 | 0.004 | 2.156 | 1.173–3.963 | 0.013 |
| Lymph node metastasis (positive/negative) | 3.660 | 2.261–5.925 | 0.000 | 4.116 | 2.442–6.936 | 0.000 |
| NFIA (high/low) | 3.031 | 1.754–5.239 | 0.000 | 3.044 | 1.697–5.457 | 0.000 |
| NFIB (high/low) | 1.333 | 0.840–2.114 | 0.222 | 1.328 | 0.809–2.179 | 0.262 |
OS, overall survival; DFS, disease‐free survival. The bold values indicated that the P value was smaller than 0.05.
Table 3.
Multivariate Cox regression analysis of the risk factors in esophageal squamous cell carcinoma
| Clinicopathologic features | OS | DFS | ||||
|---|---|---|---|---|---|---|
| HR | 95% CI | P value | HR | 95% CI | P value | |
| Gender (female/male) | 0.765 | 0.356–1.640 | 0.491 | 0.877 | 0.405–1.900 | 0.740 |
| Age (>62/≤62) | 1.331 | 0.829–2.138 | 0.236 | 1.332 | 0.800–2.217 | 0.271 |
| Tumor size (cm) (>4.3/≤4.3) | 1.479 | 0.916–2.389 | 0.110 | 0.982 | 0.583–1.656 | 0.947 |
| Differentiation degree (Well/Moderate/Poor) | 1.092 | 0.793–1.503 | 0.590 | 0.969 | 0.692–1.356 | 0.853 |
| T‐stage (T3 + T4/T1 + T2) | 2.272 | 1.224–4.217 | 0.009 | 2.228 | 1.166–4.256 | 0.015 |
| Lymph node metastasis (positive/negative) | 2.636 | 1.565–4.439 | 0.000 | 3.628 | 2.020–6.517 | 0.000 |
| NFIA (high/low) | 3.450 | 1.908–6.240 | 0.000 | 3.388 | 1.801–6.371 | 0.000 |
| NFIB (high/low) | 1.310 | 0.802–2.139 | 0.281 | 1.210 | 0.715–2.048 | 0.477 |
OS, overall survival; DFS, disease‐free survival. The bold values indicated that the P value was smaller than 0.05.
High NFIB expression correlates with lymph node metastasis and poor differentiation in EJA
The expression of NFIA and NFIB was then evaluated in EJA tissues from 26 patients, including 22 males and 4 females. The average age at diagnosis was 65.8. As shown in Figure 4A, NFIA and NFIB were expressed if any only in basal cells of normal gastric epithelial, mainly located in the nucleus. NFIB was highly expressed in EJA tissues. High expression of NFIB was found in cancerous tissues in 46.2% of the patients. The expression of both NFIA and NFIB was significantly higher than that in normal gastric epithelia (Fig. 4B). Chi‐square test revealed that high NFIB expression significantly correlated with lymph node metastasis (P = 0.014) and advanced TNM stage (P = 0.036) in EJA (Table 4). Additionally, NFIB was highly expressed in cancer tissues with lymph node metastasis in comparison with those without lymph node metastasis (Fig. 4C). However, there was no significant correlation between NFIA and clinicopathological features. Altogether, these results revealed that NFIB was highly expressed in EJA tissues and high NFIB expression correlated with lymph node metastasis and advanced TNM stage in EJA.
Figure 4.
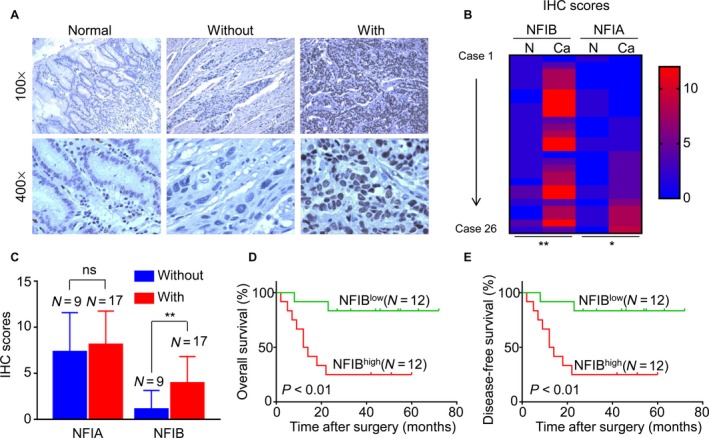
High NFIB expression predicts poor clinical outcomes of patients with esophagogastric junction adenocarcinoma (EJA). (A) Representative images showing the expression of NFIB in normal gastric epithelia and EJA tissues with or without lymph node metastasis. (B) Heat map showing the IHC scores of NFIA and NFIB in EJA tissues and corresponding normal esophageal epithelia. (C) IHC scores of NFIB in EJA tissues with or without lymph node metastasis. (D and E) The Kaplan–Meier survival analysis showing that EJA patients with high NFIB expression tend to have a shorter OS (C) or DFS (D) time. *P < 0.05; **P < 0.01.
Table 4.
Correlation between NFIA/NFIB expression and clinicopathological features in cancer tissues from 26 patients with esophagogastric junction adenocarcinoma
| Clinicopathologic features | No. of patients (%) | NFIA expression status | P value | NFIB expression status | P value | ||
|---|---|---|---|---|---|---|---|
| Low (n = 9) No. of patients (%) | High (n = 17) No. of patients (%) | Low (n = 14) No. of patients (%) | High (n = 12) No. of patients (%) | ||||
| Gender | |||||||
| Male | 22 (84.6) | 9 (40.9) | 13 (59.1) | 0.263 | 11 (50.0) | 11 (50.0) | 0.598 |
| Female | 4 (15.4) | 0 (0) | 4 (100.0) | 3 (75.0) | 1 (25.0) | ||
| Age | |||||||
| ≤66 | 12 (38.5) | 3 (30.3) | 9 (70.0) | 0.429 | 6 (50.0) | 6 (50.0) | 1.000 |
| >66 | 14 (61.5) | 6 (37.5) | 8 (62.5) | 8 (57.1) | 6 (42.9) | ||
| Tumor size (cm) | |||||||
| ≤5.4 | 12 (26.9) | 5 (57.1) | 7 (42.9) | 0.683 | 6 (50.0) | 6 (50.0) | 1.000 |
| >5.4 | 14 (73.1) | 4 (26.3) | 10 (73.7) | 8 (57.1) | 6 (42.9) | ||
| Differentiation degree | |||||||
| Well | 7 (26.9) | 2 (28.6) | 5 (71.4) | 0.662 | 4 (57.1) | 3 (42.9) | 0.186 |
| Moderate | 6 (23.1) | 3 (50.0) | 3 (50.0) | 5 (83.3) | 1 (16.7) | ||
| Poor | 13 (50.0) | 4 (30.8) | 9 (69.2) | 5 (38.5) | 8 (61.5) | ||
| T‐stage | |||||||
| T2 | 3 (11.5) | 0 (0) | 3 (100.0) | 0.407 | 3 (100.0) | 0 (0) | 0.193 |
| T3 | 18 (69.2) | 7 (38.9) | 11 (61.1) | 8 (44.4) | 10 (55.6) | ||
| T4 | 5 (19.3) | 2 (40.0) | 3 (60.0) | 3 (60.0) | 2 (40.0) | ||
| Lymph node metastasis | |||||||
| Negative | 9 (34.6) | 4 (44.4) | 5 (55.6) | 0.667 | 8 (88.9) | 1 (11.1) | 0.014 |
| Positive | 17 (65.4) | 5 (29.4) | 12 (70.6) | 6 (35.3) | 11 (64.7) | ||
| Distant metastasis | |||||||
| Negative | 26 (100.0) | 9 (34.6) | 17 (65.4) | na | 14 (53.8) | 12 (46.2) | na |
| Positive | 0 (0) | 0 (0) | 0 (0) | 0 (0) | 0 (0) | ||
| TNM stage | |||||||
| II | 8 (30.8) | 4 (50.0) | 4 (50.0) | 0.382 | 7 (87.5) | 1 (12.5) | 0.036 |
| III | 18 (69.2) | 5 (27.8) | 13 (72.2) | 7 (38.9) | 11 (61.1) | ||
Chi‐square test was used to evaluate the correlation between NFIA/NFIB expression and clinicopathological features. The bold values indicated that the P value was smaller than 0.05.
High NFIB expression predicts poor outcomes of patients with EJA
We obtained follow‐up information from 24 patients with EJA, including 20 males and 4 females. The mean time was 33.7 months. The Kaplan–Meier analysis illustrated that high NFIB expression correlated with short OS (Fig. 4D; P < 0.001) or DFS (Fig. 4E; P < 0.001) time in patients with EJA, but NFIA did not correlate with OS or DFS time (Fig. S1A and B). These results demonstrated that high NFIB expression is of negative prognostic value in EJA.
Discussion
Although much progress has been made in the last decades, the prognosis of both patients with ESCC and patients with EJA is poor. Better understanding of the pathological and molecular features of these two cancers would provide novel targets for the diagnosis and treatment of EC. The present study found that high NFIA is an independent prognostic risk factor in ESCC, while NFIB predicts poor outcomes of EJA. It is worth noting that the age of patients with EJA (65.8) was larger than that of patients with ESCC (60.8), and the tumor size of EJA (5.4 cm) was also larger than that of ESCC (4.0 cm).
Although the initial role of NFIs was demonstrated in the development of many organ systems, such as central nervous system 25 and lung 26, recent studies revealed that NFIs also play essential role in the context of cancer 7. NFIA mainly acts as a tumor‐promoting gene in glioma and ESCC 10, while NFIB exerts its oncogenic effect in SCLC, melanoma, breast cancer, and colon cancer and functions as a tumor suppressor in osteosarcoma, cutaneous squamous cell carcinoma, and NSCLC 11. Interestingly, Denny recently reported that chromatin in metastatic lesions exhibited a widespread increase in accessibility at gene distal regions that are enriched for NFI motifs, and NFIB regulates the expression of genes related to axon guidance, focal adhesion, and extracellular matrix–receptor interactions 13. Most recently, NFIB has been shown to promote proliferation of breast cancer cells in the absence of estrogen and inhibit the transcription activity of ERα 18. Consistent with the previous study that NFIA promotes growth of ESCC cells 11, we show here that NFIA is overexpressed in ESCC tissues, and high NFIA expression correlates with poor differentiation, lymph node metastasis, and advanced TNM stage in ESCC. It is worth noting that although NFIB was also overexpressed in ESCC, it is of no clinicopathological value in ESCC. On the other hand, NFIB was highly expressed in EJA, and high NFIB expression is of negative prognostic value in EJA. The small sample size of EJA is a main limitation of this work. Further work is needed to validate the role of NFIB in EJA using a large sample size. The differential roles of NFIA and NFIB reflect not only the distinct features of ESCC and EJA, but also the versatile functions of NFI family members.
The molecular mechanisms regulating the expression of NFIA and NFIB are still poorly known. Few studies showed that NFIA was targeted by microRNAs, including miR‐29a 10 and miR‐223 9. Another study demonstrated that activation of NFκB signaling directly enhanced the transcription of NFIA in glioblastoma cells 27. The expression of NFIB was also regulated by microRNAs, such as miR‐372/373 28, miR‐153 29, 30, miR‐365 21, and miR‐124 31. In adult neural progenitors, the Pax6–BAF complex transcriptionally upregulated NFIB 8. Additionally, Drosha was recently reported to directly repress the transcription of NFIB independently of Dicer and microRNAs in adult neural stem cells 25. Estrogen receptors ER and PR might downregulate NFIB as it has been reported that the expression of NFIB was conversely associated with that of ER and PR 17. The molecular mechanisms by which NFIA and NFIB are upregulated in EC need to be illustrated. Moreover, how NFIA and NFIB exert their oncogenic roles in ESCC or EJA remains to be explored.
In conclusion, the present work revealed the clinicopathological and prognostic value of NFIA in ESCC and NFIB in EJA. High NFIA expression and high NFIB expression are associated with poor prognosis of patients with ESCC and patients with EJA, respectively. These results suggest that NFIA and NFIB might be novel markers for the diagnosis and treatment of ESCC and EJA, respectively.
Conflict of Interest
The authors declare no conflict of interest.
Supporting information
Figure S1. NFIA expression does not correlate with prognosis of patients with EJA.
Acknowledgments
This study was funded by the National Natural Science Fund (No. 81573026), National Natural Science Fund for Youth (No. 81602097), Beijing Municipal Natural Science Foundation (7182162), Beijing Nova Project (xx2018112) Supporting Fund for Clinical Research of the PLA General Hospital (No. 2017FC‐TSYS‐2036), and the Key Project in Military Logistics Research (No. BWS14J041).
Cancer Medicine 2018; 7(5):1756–1765
References
- 1. Torre, L. A. , Bray F., Siegel R. L., Ferlay J., Lortet‐Tieulent J., and Jemal A.. 2015. Global cancer statistics, 2012. CA Cancer J. Clin. 65:87–108. [DOI] [PubMed] [Google Scholar]
- 2. Yang, Y. S. , Hu W. P., Ni P. Z., Wang W. P., Yuan Y., and Chen L. Q.. 2017. Esophageal luminal stenosis is an independent prognostic factor in esophageal squamous cell carcinoma. Oncotarget 8:43397–43405. [DOI] [PMC free article] [PubMed] [Google Scholar]
- 3. Buas, M. F. , and Vaughan T. L.. 2013. Epidemiology and risk factors for gastroesophageal junction tumors: understanding the rising incidence of this disease. Semin. Radiat. Oncol. 23:3–9. [DOI] [PMC free article] [PubMed] [Google Scholar]
- 4. Hui, Z. , and Xianglin M.. 2016. Association of HOTAIR expression with PI3K/Akt pathway activation in adenocarcinoma of esophagogastric junction. Open Med. (Wars) 11:36–40. [DOI] [PMC free article] [PubMed] [Google Scholar]
- 5. Tang, W. , Chen S., Chen Y., Lin J., Lin J., Wang Y., et al. 2017. Programmed death‐1 polymorphisms is associated with risk of esophagogastric junction adenocarcinoma in the Chinese Han population: a case–control study involving 2,740 subjects. Oncotarget 8:39198–39208. [DOI] [PMC free article] [PubMed] [Google Scholar]
- 6. Hu, W. , Liang Y., Zhang S., Hu Y., and Liu J.. 2014. The significance of subcarinal dissection in esophageal cancer surgery. Asia Pac. J. Clin. Oncol. 10:183–189. [DOI] [PubMed] [Google Scholar]
- 7. Fane, M. , Harris L., Smith A. G., and Piper M.. 2017. Nuclear factor one transcription factors as epigenetic regulators in cancer. Int. J. Cancer 140:2634–2641. [DOI] [PubMed] [Google Scholar]
- 8. Ninkovic, J. , Steiner‐Mezzadri A., Jawerka M., Akinci U., Masserdotti G., Petricca S., et al., et al. 2013. The BAF complex interacts with Pax6 in adult neural progenitors to establish a neurogenic cross‐regulatory transcriptional network. Cell Stem Cell 13:403–418. [DOI] [PMC free article] [PubMed] [Google Scholar]
- 9. Glasgow, S. M. , Laug D., Brawley V. S., Zhang Z., Corder A., Yin Z., et al., et al. 2013. The miR‐223/nuclear factor I‐A axis regulates glial precursor proliferation and tumorigenesis in the CNS. J. Neurosci. 33:13560–13568. [DOI] [PMC free article] [PubMed] [Google Scholar]
- 10. Liu, C. , Duan P., Li B., Huang C., Jing Y., and Yan W.. 2015. miR‐29a activates Hes1 by targeting Nfia in esophageal carcinoma cell line TE‐1. Oncol. Lett. 9:96–102. [DOI] [PMC free article] [PubMed] [Google Scholar]
- 11. Becker‐Santos, D. D. , Lonergan K. M., Gronostajski R. M., and Lam W. L.. 2017. Nuclear Factor I/B: a master regulator of cell differentiation with paradoxical roles in cancer. EBioMedicine 22:2–9. [DOI] [PMC free article] [PubMed] [Google Scholar]
- 12. Dooley, A. L. , Winslow M. M., Chiang D. Y., Banerji S., Stransky N., Dayton T. L., et al., et al. 2011. Nuclear factor I/B is an oncogene in small cell lung cancer. Genes Dev. 25:1470–1475. [DOI] [PMC free article] [PubMed] [Google Scholar]
- 13. Denny, S. K. , Yang D., Chuang C. H., Brady J. J., Lim J. S., Gruner B. M., et al., et al. 2016. Nfib promotes metastasis through a widespread increase in chromatin accessibility. Cell 166:328–342. [DOI] [PMC free article] [PubMed] [Google Scholar]
- 14. Semenova, E. A. , Kwon M. C., Monkhorst K., Song J. Y., Bhaskaran R., Krijgsman O., et al., et al. 2016. Transcription factor NFIB is a driver of small cell lung cancer progression in mice and marks metastatic disease in patients. Cell Rep. 16:631–643. [DOI] [PMC free article] [PubMed] [Google Scholar]
- 15. Wu, N. , Jia D., Ibrahim A. H., Bachurski C. J., Gronostajski R. M., and MacPherson D.. 2016. NFIB overexpression cooperates with Rb/p53 deletion to promote small cell lung cancer. Oncotarget 7:57514–57524. [DOI] [PMC free article] [PubMed] [Google Scholar]
- 16. Fane, M. E. , Chhabra Y., Hollingsworth D. E., Simmons J. L., Spoerri L., Oh T. G., et al., et al. 2017. NFIB mediates BRN2 driven melanoma cell migration and invasion through regulation of EZH2 and MITF. EBioMedicine 16:63–75. [DOI] [PMC free article] [PubMed] [Google Scholar]
- 17. Moon, H. G. , Hwang K. T., Kim J. A., Kim H. S., Lee M. J., Jung E. M., et al. 2011. NFIB is a potential target for estrogen receptor‐negative breast cancers. Mol. Oncol. 5:538–544. [DOI] [PMC free article] [PubMed] [Google Scholar]
- 18. Campbell, T. M. , Castro M. A. A., de Oliveira K. G., Ponder B. A. J., and Meyer K. B.. 2018. ERalpha binding by transcription factors NFIB and YBX1 enables FGFR2 signaling to modulate estrogen responsiveness in breast cancer. Can. Res. 78:410–421. [DOI] [PMC free article] [PubMed] [Google Scholar]
- 19. Kashiwagi, E. , Izumi H., Yasuniwa Y., Baba R., Doi Y., Kidani A., et al. 2011. Enhanced expression of nuclear factor I/B in oxaliplatin‐resistant human cancer cell lines. Cancer Sci. 102:382–386. [DOI] [PubMed] [Google Scholar]
- 20. Mirabello, L. , Koster R., Moriarity B. S., Spector L. G., Meltzer P. S., Gary J., et al., et al. 2015. A genome‐wide scan identifies variants in NFIB associated with metastasis in patients with osteosarcoma. Cancer Discov. 5:920–931. [DOI] [PMC free article] [PubMed] [Google Scholar]
- 21. Zhou, L. , Wang Y., Ou C., Lin Z., Wang J., Liu H., et al. 2015. microRNA‐365‐targeted nuclear factor I/B transcriptionally represses cyclin‐dependent kinase 6 and 4 to inhibit the progression of cutaneous squamous cell carcinoma. Int. J. Biochem. Cell Biol. 65:182–191. [DOI] [PubMed] [Google Scholar]
- 22. Becker‐Santos, D. D. , Thu K. L., English J. C., Pikor L. A., Martinez V. D., Zhang M., et al., et al. 2016. Developmental transcription factor NFIB is a putative target of oncofetal miRNAs and is associated with tumour aggressiveness in lung adenocarcinoma. J. Pathol. 240:161–172. [DOI] [PubMed] [Google Scholar]
- 23. Rice, T. W. , Gress D. M., Patil D. T., Hofstetter W. L., Kelsen D. P., and Blackstone E. H.. 2017. Cancer of the esophagus and esophagogastric junction‐Major changes in the American Joint Committee on Cancer eighth edition cancer staging manual. CA Cancer J. Clin. 67:304–317. [DOI] [PubMed] [Google Scholar]
- 24. Zhou, Z. H. , Rao J., Yang J., Wu F., Tan J., Xu S. L., et al., et al. 2015. SEMA3F prevents metastasis of colorectal cancer by PI3K‐AKT‐dependent down‐regulation of the ASCL2‐CXCR4 axis. J. Pathol. 236:467–478. [DOI] [PubMed] [Google Scholar]
- 25. Rolando, C. , Erni A., Grison A., Beattie R., Engler A., Gokhale P. J., et al. 2016. Multipotency of adult hippocampal NSCs in vivo is restricted by Drosha/NFIB. Cell Stem Cell 19:653–662. [DOI] [PubMed] [Google Scholar]
- 26. Grunder, A. , Ebel T. T., Mallo M., Schwarzkopf G., Shimizu T., Sippel A. E., et al. 2002. Nuclear factor I‐B (Nfib) deficient mice have severe lung hypoplasia. Mech. Dev. 112:69–77. [DOI] [PubMed] [Google Scholar]
- 27. Lee, J. , Hoxha E., and Song H. R.. 2017. A novel NFIA‐NFkappaB feed‐forward loop contributes to glioblastoma cell survival. Neuro Oncol. 19:524–534. [DOI] [PMC free article] [PubMed] [Google Scholar]
- 28. Guo, H. , Liu H., Mitchelson K., Rao H., Luo M., Xie L., et al., et al. 2011. MicroRNAs‐372/373 promote the expression of hepatitis B virus through the targeting of nuclear factor I/B. Hepatology 54:808–819. [DOI] [PubMed] [Google Scholar]
- 29. Tsai, P. C. , Bake S., Balaraman S., Rawlings J., Holgate R. R., Dubois D., et al. 2014. MiR‐153 targets the nuclear factor‐1 family and protects against teratogenic effects of ethanol exposure in fetal neural stem cells. Biol. Open 3:741–758. [DOI] [PMC free article] [PubMed] [Google Scholar]
- 30. Tsuyama, J. , Bunt J., Richards L. J., Iwanari H., Mochizuki Y., Hamakubo T., et al. 2015. MicroRNA‐153 regulates the acquisition of gliogenic competence by neural stem cells. Stem Cell Rep. 5:365–377. [DOI] [PMC free article] [PubMed] [Google Scholar]
- 31. Wang, Y. , Huang C., Chintagari N. R., Xi D., Weng T., and Liu L.. 2015. miR‐124 regulates fetal pulmonary epithelial cell maturation. Am. J. Physiol. Lung Cell. Mol. Physiol. 309:L400–L413. [DOI] [PMC free article] [PubMed] [Google Scholar]
Associated Data
This section collects any data citations, data availability statements, or supplementary materials included in this article.
Supplementary Materials
Figure S1. NFIA expression does not correlate with prognosis of patients with EJA.