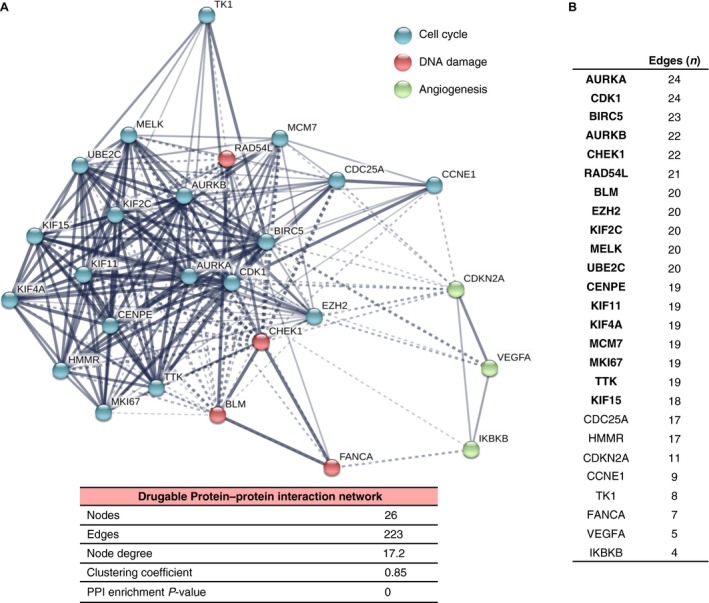
Figure 4.

Protein–protein interaction (PPI) map of the 26 potential druggable targets. (A) Potentially druggable targets were used to construct a PPI network using the online tool STRING. Blue nodes represent proteins involved in cell cycle. Red and green nodes represent proteins associated with DNA damage and angiogenesis, respectively. The nodes indicate proteins coded by the identified druggable targets and edges indicate the number of interactions. The number of average interactions per node is represented by the node degree. The clustering coefficient indicates the average node density of the map. (B) List of hub proteins according the number of interactions (edges) in the druggable PPI network.
