
FIGURE 3.
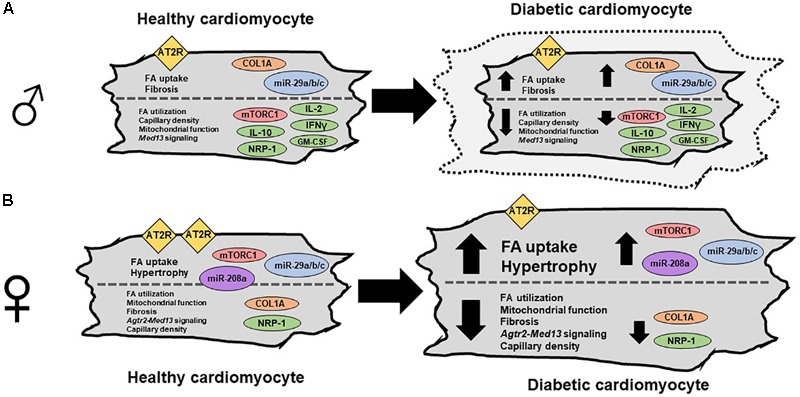
Sex differences in cardiomyocytes between healthy and diabetic cardiomyopathy. (A) Diagram of a male cardiomyocyte as it progresses from healthy to diabetic cardiomyopathy. In male, mTORC1 activation and hypertrophy are observed in some models but not others (indicated by dashed outer cardiomyocyte outline), while AT2R expression is not changed. While fatty acid (FA) uptake, fibrosis, collagen 1a, and miR-29a/b/c/ are increased with disease progression, the following are all reduced with disease progression; FA utilization, capillary density, mitochondrial function, and Med13-signaling, and several cytokines including IL-2, IL-10, IFN-γ, and GM-CSF. (B) Diagram of a female cardiomyocyte as it progresses from healthy to diabetic cardiomyopathy. In the female, mTORC1 activation and hypertrophy are observed. Additionally, miR-208a and miR-29a/b/c are increased, while FA utilization, mitochondrial function, fibrosis, Agtr2-Med13 signaling, capillary density, collagen 1a, and NRP-1 are decreased (Widdop et al., 2003; Miki et al., 2013; Schilling and Mann, 2014; Lum-Naihe et al., 2017).