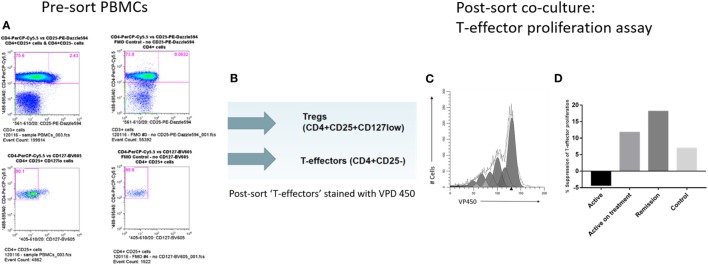
Figure 2.
Cell sorting and T-regulatory cell (Treg) suppression assays. (A) Cell sorting strategy to isolate Treg (CD4+CD25+CD127lo) and T-effectors (CD4+CD25−) in CD3+ T-cell subset. (B) Post-cell sort staining of T-effectors with violet proliferation dye (VPD) 450 cell tracking dye. (C) Modfit modeling of in vitro T-cell proliferation index using VPD 450. (D) Comparison of % suppression of T-cell proliferation by Treg isolated from the different subject groups.

