
Figure 1.
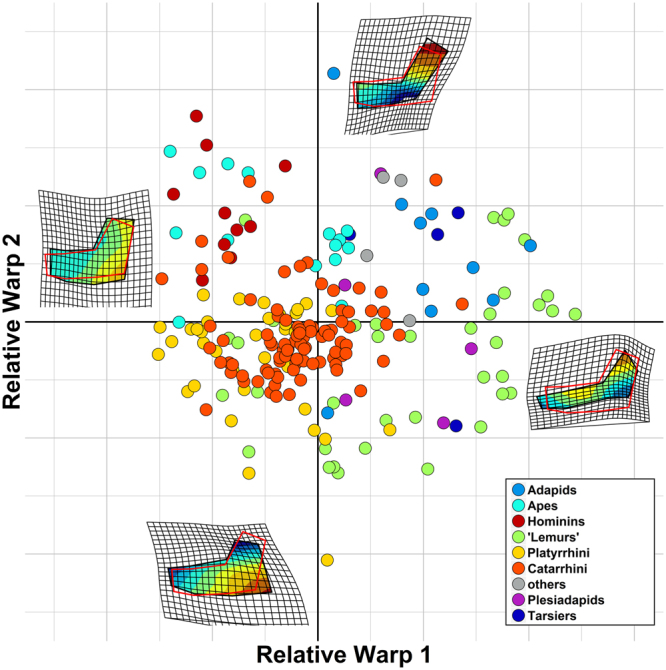
The major axes of mandibular shape variation in primates, retrieved from GMM. Homo and the australopiths almost exclusively occupy the upper left quadrant of the plot (purple circle). At the two extremes of both axes we reported the shape deformation associated to these axes, overimposed on the primate consensus shape (in red) and a continuous colour scale representing the mandibular areas or more intense deformation, from areas where the mandible widens compared to the consensus (in red) to areas where it compresses (in blue). The image was generated by using the R package ggplot (http://ggplot2.org/) and our own R codes.