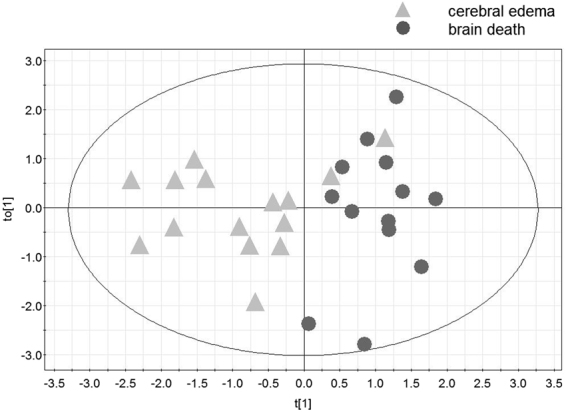
Figure 3.

Orthogonal partial least squares-discriminant analysis (OPLS-DA) scores plot of ICG inflow and outflow variables showing separation between the two groups: patients with posttraumatic cerebral edema and those with brain death (model 2). to[1] represents within-class variation in the first orthogonal component, while t[1] represents between-class variation in the first predictive component. The ellipse represents Hotelling T2 with 95% confidence in the scores plots.
