Figure 4.
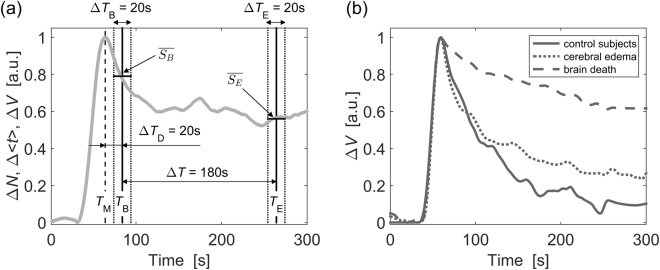
(a) Algorithm for the data analysis used in the assessment of the ICG washout ratio. TM - time of maximum amplitude of the signal, TB – time at which the baseline signal level was obtained (20 seconds after TM). Averaged signal amplitude was calculated within the ΔTB period. TE – time at which the late signal level was obtained (180 seconds after TB). - averaged signal amplitude within the ΔTE period. (b) Examples of normalized time courses of variance of the statistical moments of the distributions of times of arrival (DTAs) of fluorescence photons (ΔVF) acquired during injection of ICG in a control subject, patient with brain edema and patient with brain death. RVF variables calculated from these signals (ΔVF) were most significant in study groups differentiation (please, see Results section). For presentation purposes signals obtained in different subjects/patients were aligned by their maximum value.

