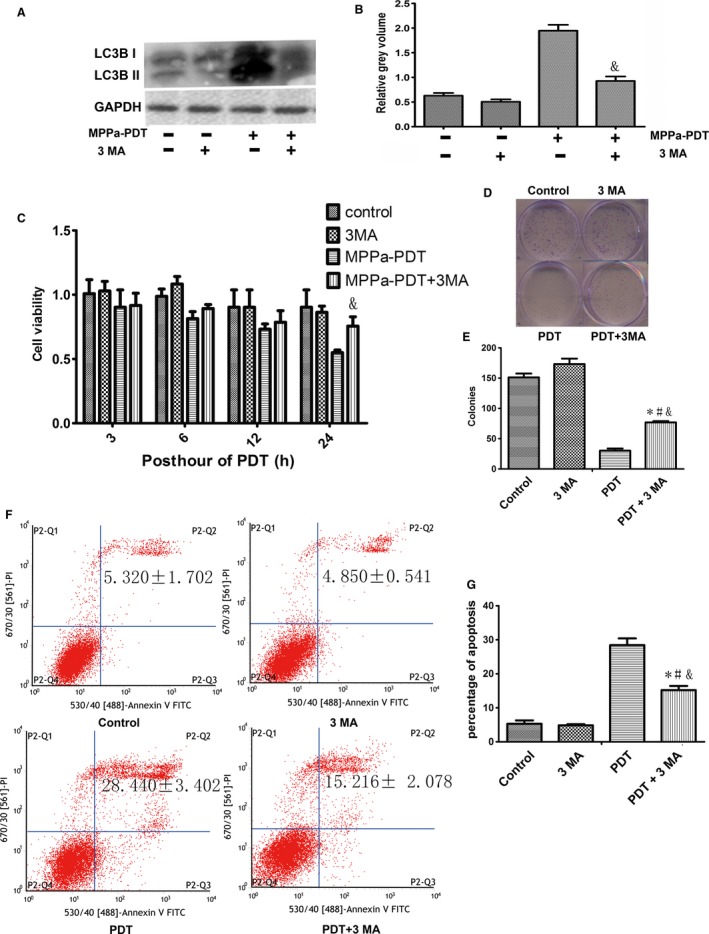
Figure 3.

Effects of 3‐MA on MPPa‐PDT induced cell death. (A) Expression of LC3B II proteins Lanes; (B) Relative Grey volume of LC3B II; (C) Cell viability of MPPa‐PDT + 3 MA at different hours post PDT, detected by the CCK‐8 assay; (D) The long proliferation was detected by colony‐forming assay staining with crystal violet; (E) The number of colony‐forming unit; (F) Apoptosis detected by annexin V/PI double‐staining; (G) Percentage of apoptosis *P < 0.05, MPPa‐PDT + 3MA vs. control. #P < 0.05, MPPa‐PDT+3MA vs. 3 MA; &P < 0.05 MPPa‐PDT + 3MA vs. MPPa‐PDT. Values are mean ± SD of three independent determinations.
