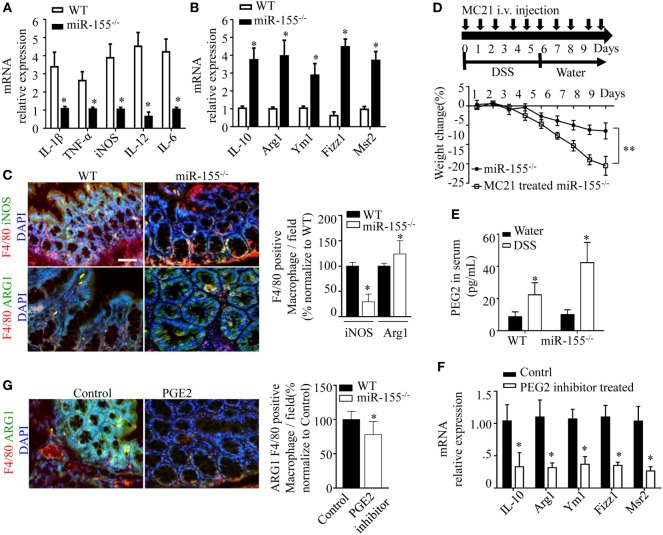
Figure 4.
miR-155 ablation suppresses M1 polarization and reciprocally promotes M2 phenotype in dextran sulfate sodium (DSS)-induced colitis. (A–C) Total RNA was isolated from colon tissues of WT (n = 5) or miR-155−/− (n = 5) mice that were given 3% DSS in drinking water for 5 days, followed by regular drinking water for 6 days. The relative expression of mRNA associated with M1-polarized macrophages (A) and M2-polarized macrophages (B) was measured by Q-PCR. (C) Representative immunofluorescence images (left) and the quantification (right) of M1 and M2 in colon tissues co-stained with macrophage F4/80 (green), iNOS/Arg1 (red), and DAPI (nuclei, blue). (D) In miR-155−/− mice (n = 8), depletion of Ly6Chi monocytes in the blood was achieved using MC21 antibody during DSS colitis induction as the schematic protocol indicated (up) resulted in aggravated DSS symptoms (down). (E) Serum levels of PEG2 in WT (n = 5) and miR-155−/− (n = 5) mice at day 2 of DSS colitis were determined by ELISA. (F–G) miR-155−/− mice (n = 5/group) were i.p. injected with PGE2 inhibitor at DSS treatment days 1, 3, and 5. The relative expressions of M2 genes were measured by Q-PCR (F), and the number of M2(F4/80+ Arg1+) was determined by immunofluorescence (G). *P < 0.05 vs WT control [Student’s t-test in (A–G)]. Data are representative of two or three independent experiments (mean and SD). ns, not significant; WT, wild-type; CBA, cecal bacterial antigen; Arg1, arginase-1.

