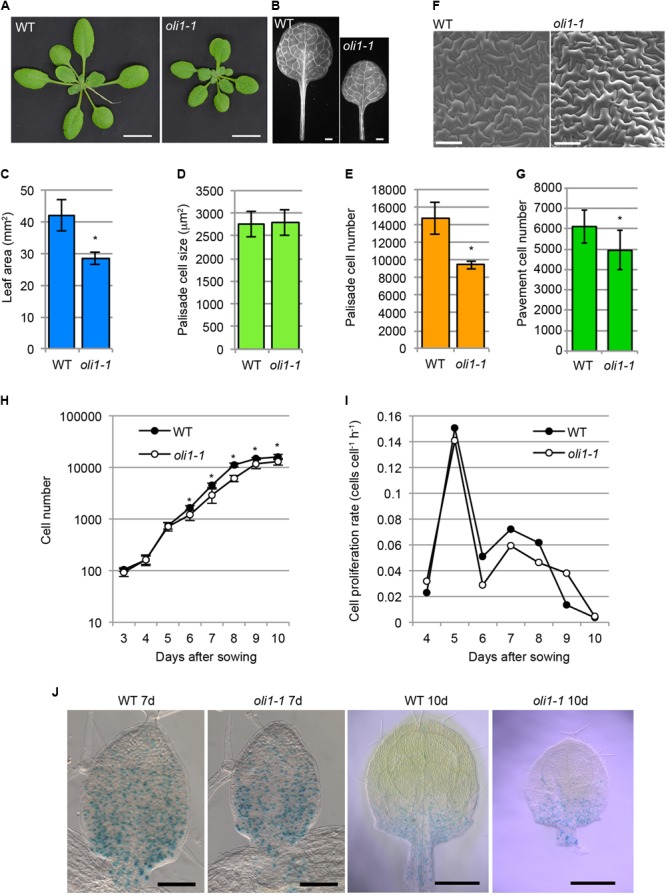
FIGURE 1.

Characterizations of the leaf phenotypes in oli1-1. (A) Shoots of wild-type (WT) and oli1-1. (B) First leaves of WT and oli1-1. (C) The areas of the first leaf blades. (D,E) Quantitative phenotypes of palisade cells in the adaxial subepidermal layer (hereafter called palisade cells for simplicity) of the first leaves of WT and oli1-1. The projection areas of palisade cells of the first leaves (D), and estimated palisade cell numbers (E) are shown. (F) Adaxial epidermis in the first leaves of WT and oli1-1 observed under a scanning electron microscope. (G) Pavement cell numbers in the adaxial epidermal tissue first leaves. (H,I) Time course analysis of first leaf development. Changes in the cell number (H) and cell proliferation rate (I) were determined by observing the palisade cell layers of first leaf primordia at the indicated days after sowing. (J) Expression pattern of pCYCB1;1::GUS in WT and oli1-1 grown for 7 (left two panels) and 10 days (right two panels). Scale bars in (A) and (B) correspond to 1 cm and 1 mm, respectively, those in (F) and the left two panels in (J) are 100 μm, and those in the right two panels in (J) are 0.5 mm. In (A–G), the samples were harvested at 21 days after sowing. In (C–H), the data are shown as means ± SD (n = 10), and asterisks indicate statistically significant differences between WT and oli1-1 (Student’s t-test, p < 0.05). In (I), the data were calculated from those shown in (H).
