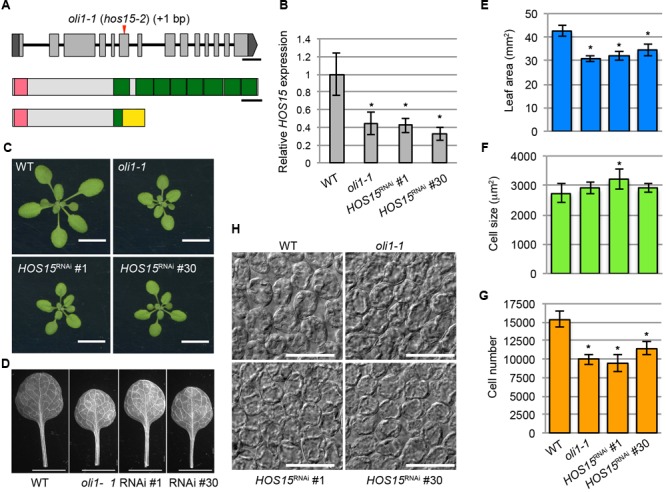
FIGURE 3.

Identification of the causal gene of the oli1-1 mutation. (A) Schematic diagrams of the OLI1/HOS15 locus (top) and HOS15 protein (middle) and the deduced structure of mutated oli1-1 protein (bottom). The mutation point of oli1-1 (renamed hos15-2) is indicated by a red arrowhead. Exons and introns are indicated by boxes and lines, respectively. The 5′- and 3′-untranslated regions of OLI1/HOS15 are indicated in dark gray, while the coding regions are indicated in light gray. The amino-terminal LisH motifs are indicated by pink boxes, while the carboxy-terminal WD40 repeats are indicated by green boxes. A yellow box indicates the region generated due to the frame shift by the oli1-1 mutation. Bars indicate 300 bp and 50 amino acids, respectively. (B–G) Characterization of HOS15 knockdown plants by RNAi (HOS15RNAi No. 1 and No. 30). (B) Expression levels of HOS15 determined by RT-qPCR using 10-day-old shoots. Data are shown as means ± SD. Asterisks indicate statistically significant differences compared with the WT value (n = 3, Student’s t-test, p < 0.05). (C) Shoots. (D) First leaves. (E) Areas of the first leaves. (F) Projection area of the palisade cells. (G) Estimated palisade cell numbers. (H) Palisade cells observed from the paradermal view. In (C–H), 21-day-old plants were used. In (E–G), the data are shown as means ± SD (n = 10), and the asterisks indicate significant differences compared with the WT values (Student’s t-test; p < 0.05). The bars in (C), (D), and (H) indicate 1 cm, 5 mm, and 100 μm, respectively.
