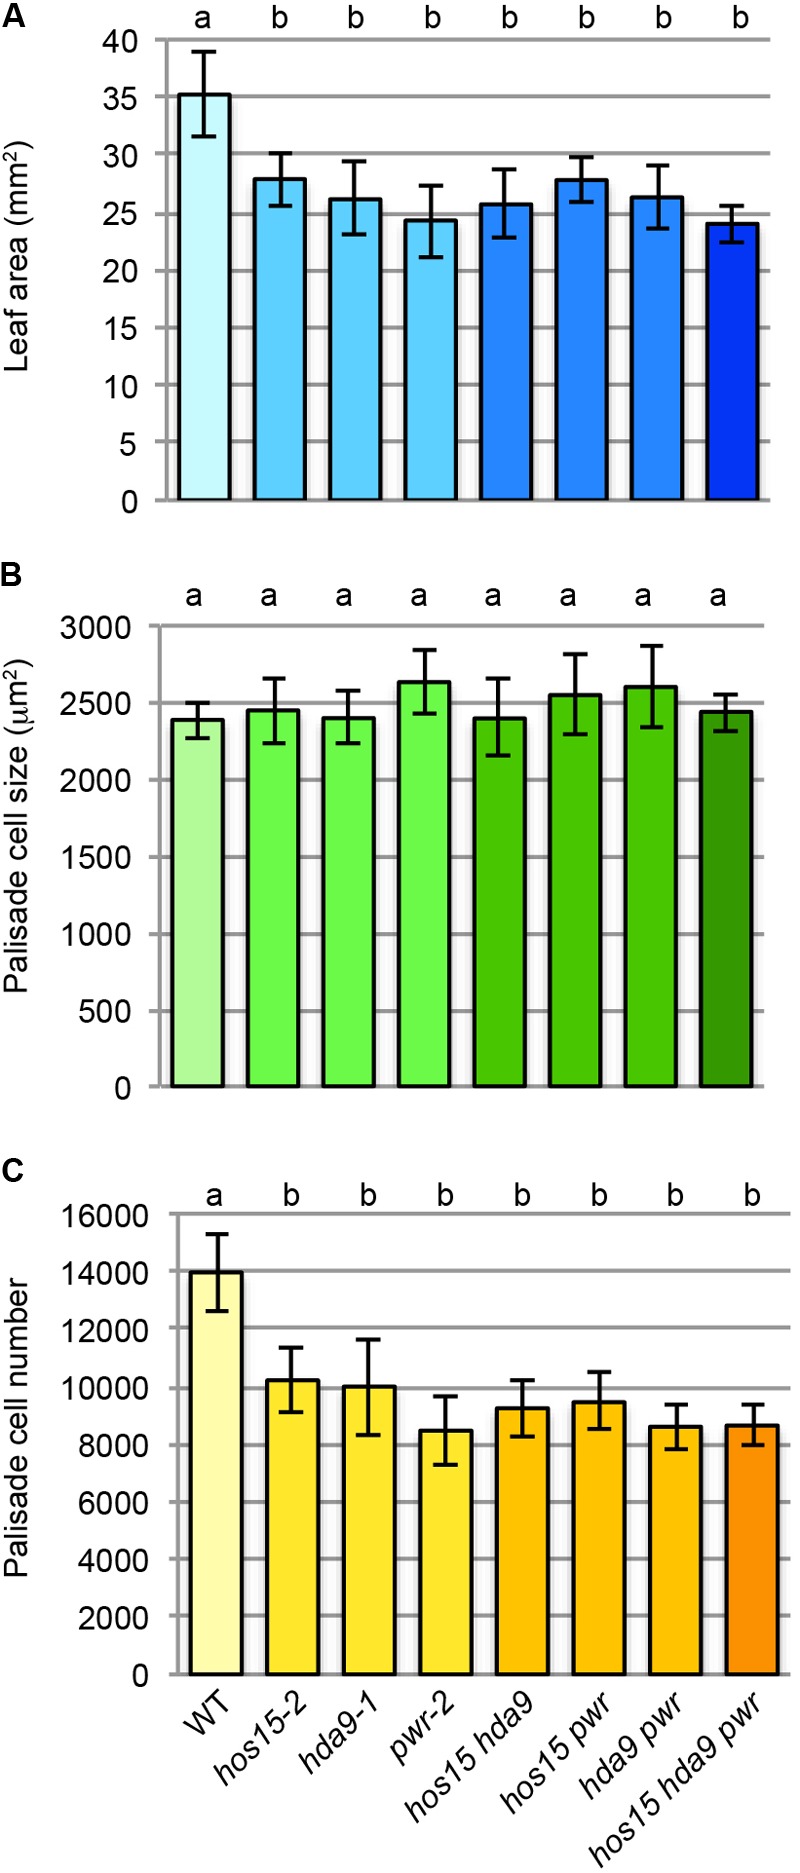
FIGURE 4.

Multiple mutant analyses among hos15-2, hda9-1, and pwr-2. (A) Leaf area. (B) Palisade cell size. (C) Palisade cell number. The first leaves of 25-day-old leaves were used for the quantitative analyses (n = 9–11). Statistical analyses were carried out by one-way ANOVA using the Tukey–Kramer post hoc test (p < 0.01). Data without a significant difference are labeled by the same letter.
