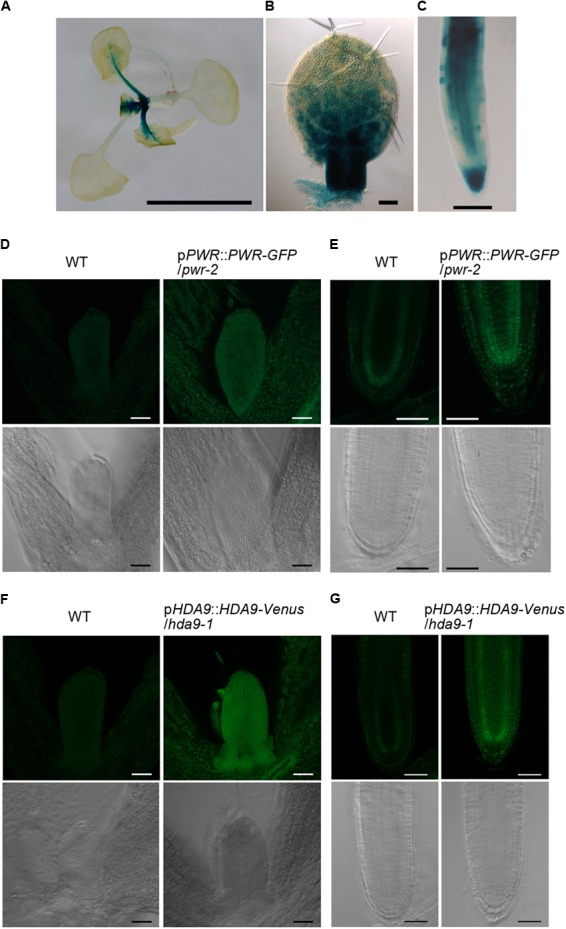
FIGURE 5.

Expression patterns of HOS15, HDA9, and PWR and intracellular distribution of HDA9 and PWR. (A–C) Histochemical GUS staining of pHOS15::GUS plants. (A) A 14-day-old plant grown on rockwool. (B) First leaf primordium of an 8-day-old plant. (C) Primary root tip of a 7-day-old plant grown in vitro. (D,E) A 4-day-old pPWR::PWR-GFP/pwr-2 plant grown in vitro. (F,G) A 4-day-old pHDA9::HDA9-Venus/hda9-1 plant grown in vitro. (D,F) Shoot tips. (E,G) Root apical meristems. In (D–G), WT plants were observed as a negative control and are shown in the left two panels. Images of transgenic plants carrying the PWR-GFP or HDA9-Venus construct are shown in the right two panels. Fluorescent images are shown in the upper rows while differential interference contrast images are shown in the lower rows. Bars in (A), and (D–G) indicate 5 mm and 50 μm, respectively, while those in (B) and (C) indicate 100 μm.
