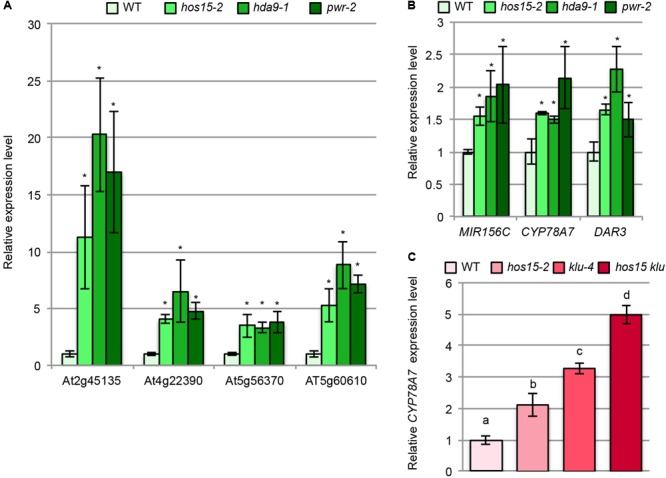
FIGURE 7.

Expression analyses of the putative downstream genes of HOS15, HDA9, and PWR. (A,B) Total RNA from the shoots of 10-day-old WT, hos15-2, hda9-1, and pwr-2 seedlings were subjected to RT-qPCR analyses. (C) Total RNA from the shoots of 10-day-old WT, hos15-2, klu-4, and hos15-2 klu-4 seedlings were subjected to RT-qPCR analyses. n = 3, mean ± SD. Statistical analyses in (A) and (B) utilized Student’s t-test (p < 0.05) while that in (C) utilized one-way ANOVA with Tukey’s HSD test (p < 0.05).
