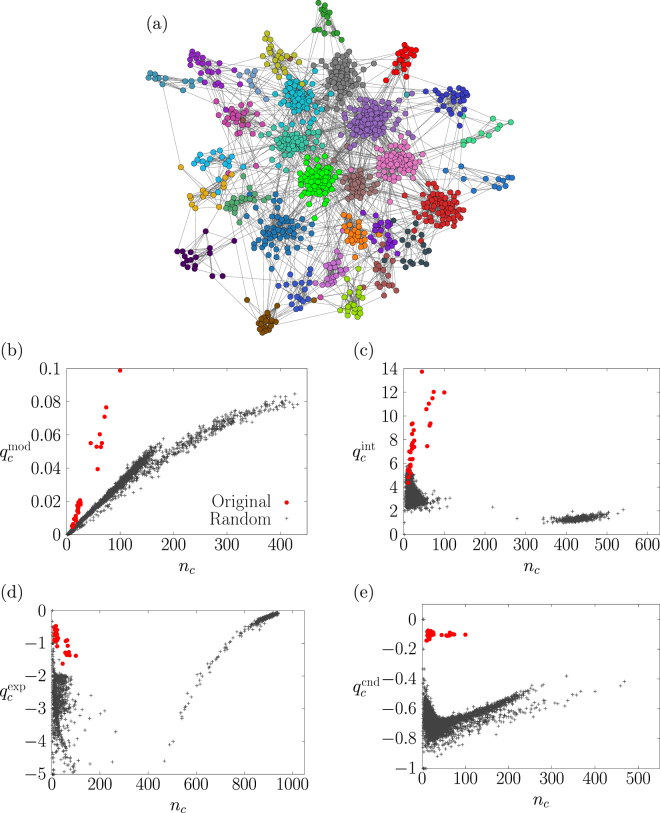
Figure 1.
(a) A network with 31 non-overlapping communities generated by the LFR model. The circles represent nodes. The lines between the nodes represent edges. The colour of each node indicates the planted community to which the node belongs. (b–e) Quality of a community (i.e., , , and ) plotted against its number of nodes, nc. The circles indicate the planted communities shown in panel (a). The crosses indicate the communities detected in 500 randomised networks generated by the configuration model. To find communities in the randomised networks, we use the Louvain algorithm26 for (panel (b)) and a variant of the Kernighan–Lin algorithm27 for , and (panels (c–e)).

