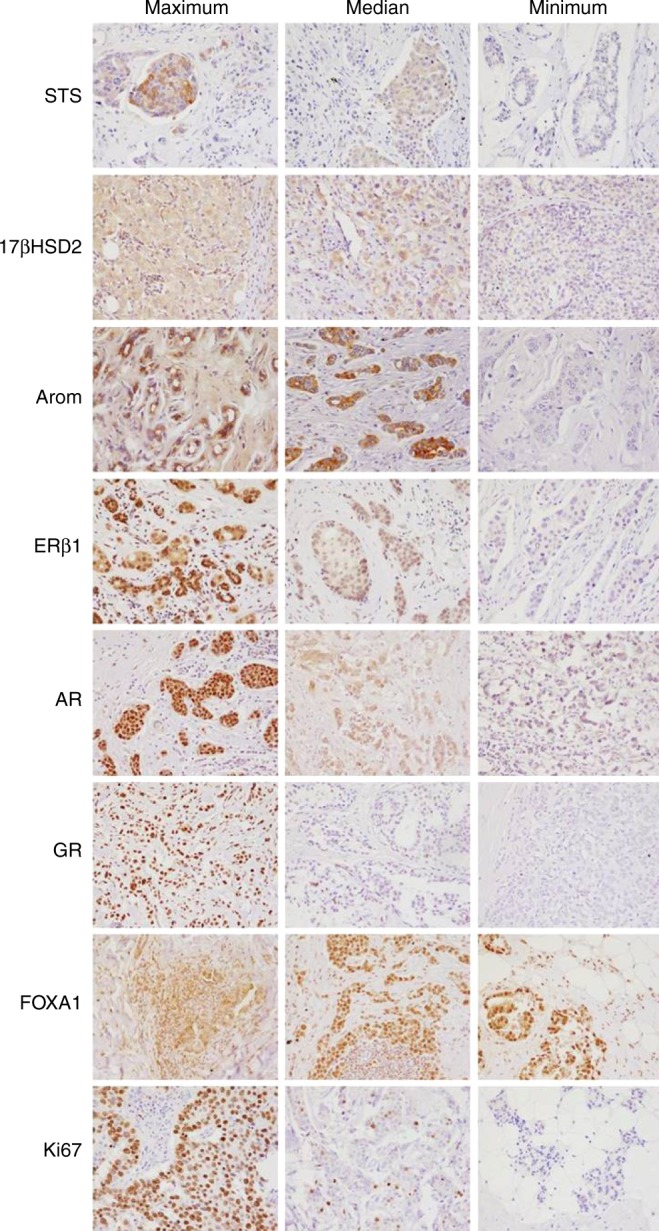
Fig. 2.

Representative IHC images of immunohistochemical stains in breast cancer samples. For each stain we chose the maximal, median and minimal values of the stain and have shown the representative images (×200 magnification). Note in most cases the epithelial location of the staining. While not illustrated here is should be noted that over and entire section of cancer tissue some of these stains were heterogeneous thus the possibility of steroid expressing subpopulations within the one tumour should not be ruled out. At present however there are few scoring approaches to adequately asses this issue and as such it is not dealt with in this manuscript
