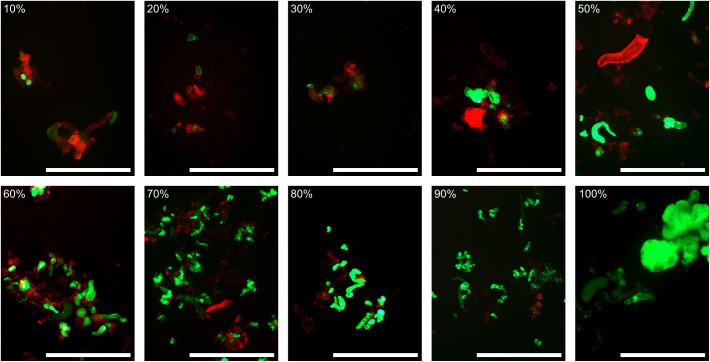
FIGURE 7.
A scale of automatically calculated live cells percentage. During this study, more than 550 fluorescein diacetate/propidium iodide stained carrot cell images were obtained. For each image, a percentage of live cells was calculated using our macro-based automated method. For values from 10 to 100% live cells, representative images were selected. Effective percentage of live cells is within one percent of the scale value. Red channel and contrast were then normalized for visibility. Bar: 1 mm.

