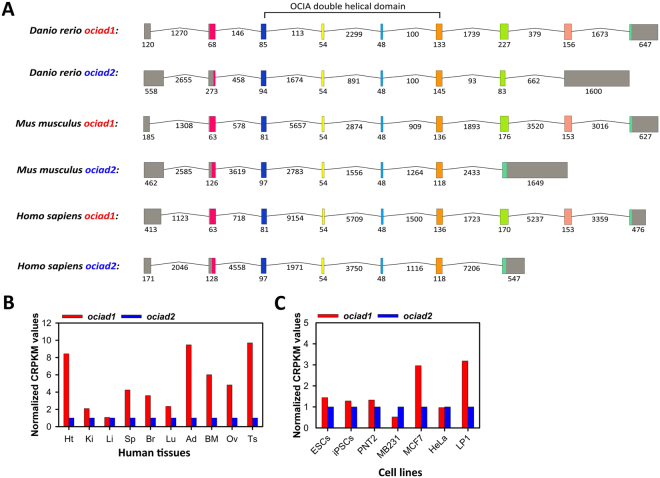
Figure 3.
Intron-exon structure of the ociad1/2 genes and comparison of their transcript levels in human tissues and cell lines. (A) Intron-exon structures of the genes coding for OCIAD1 and OCIAD2 in human, mouse and zebra fish. Intron-exon structure for the longest transcript was obtained from the Ensemble database (Accession numbers: ENST00000381473.7, ENSMUST00000031038.10, ENSDART00000103365.4, ENST00000508632.5, ENSMUST00000087195.8 and ENSDART00000164503.1). Colored boxes correspond to exons, grey-color indicates untranslated regions. Black solid lines represent introns. The size of introns and exons in nucleotides is mentioned. Introns are not drawn to scale. Exons coding for the double helical domain of OCIAD proteins have been indicated. (B) Comparison of transcript levels of ociad1 and ociad2 across different human tissues and cell lines as per data obtained from the Vertebrate Alternative Splicing and Transcription Database (VastDB, http://vastdb.crg.eu/).

