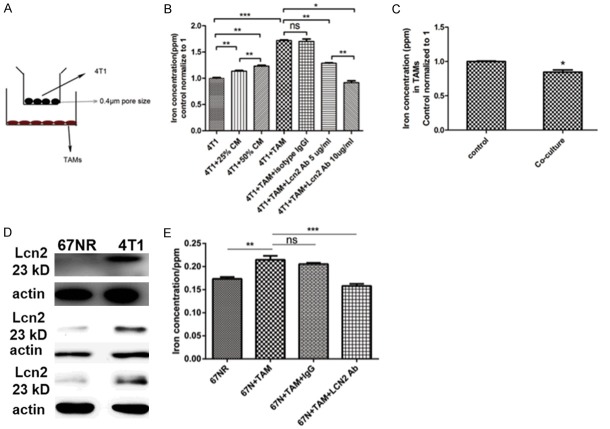
Figure 4.
ICP/MS detection of iron concentration. A. Transwell with 0.4 μm pore size of membrane only allows secreted small molecules transported into upper chamber. B. ICP/MS detection of iron concentration in 4T1 cells. n=4. *P<0.05, **P<0.01, ***P<0.001 by Student’s t-test. C. TAMs iron concentration before and after co-culture with 4T1 cells. *P<0.05 by Student’s t-test. n=4. D. The expression of Lcn2 in 67NR cells and 4T1 cells. The western blots were repeated three times. E. Iron concentration of 67NR with and without coculture with TAMs. n=4. Data was shown as mean ± SD. **P<0.01, ***P<0.001 by two way ANOVA.

