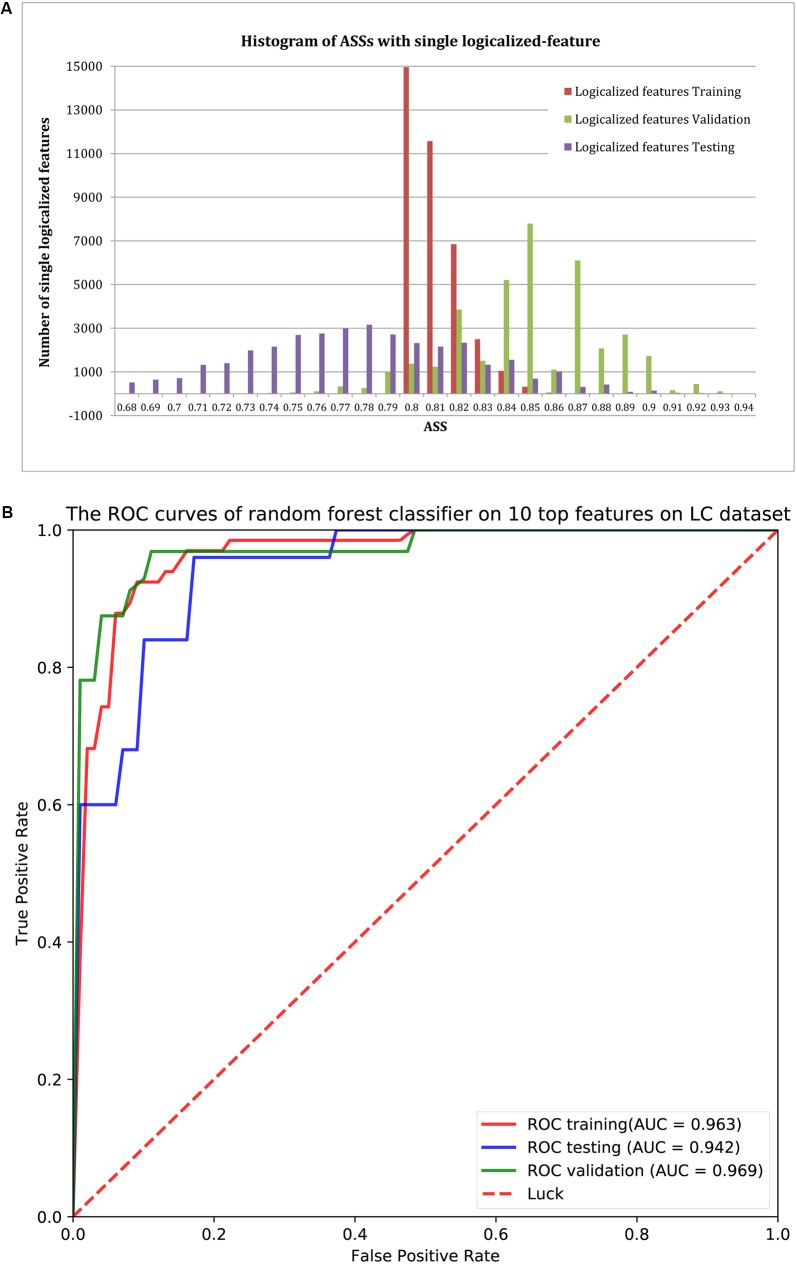
FIGURE 3.
(A) The distribution of ASS values of the 37,302 single-logical-feature predictors and 345 single-numerical logistic-regression predictors on the identified group-specific features for training, validation, and testing sets. These predictors achieved better performance in the validation set compared to the training set. A total of 35,652 group-specific features achieved ASS ≥ 0.8 for the validation set, and 12,944 of them achieved ASS ≥ 0.8 for the testing set. (B) ROC curves of the random forests classifier with the top 10 features on validation and testing sets. Using the top 10 group-specific 40-mers, the random forests classifier achieved AUC of 0.963, 0.969, and 0.942 on training, validation, and testing sets, respectively.

