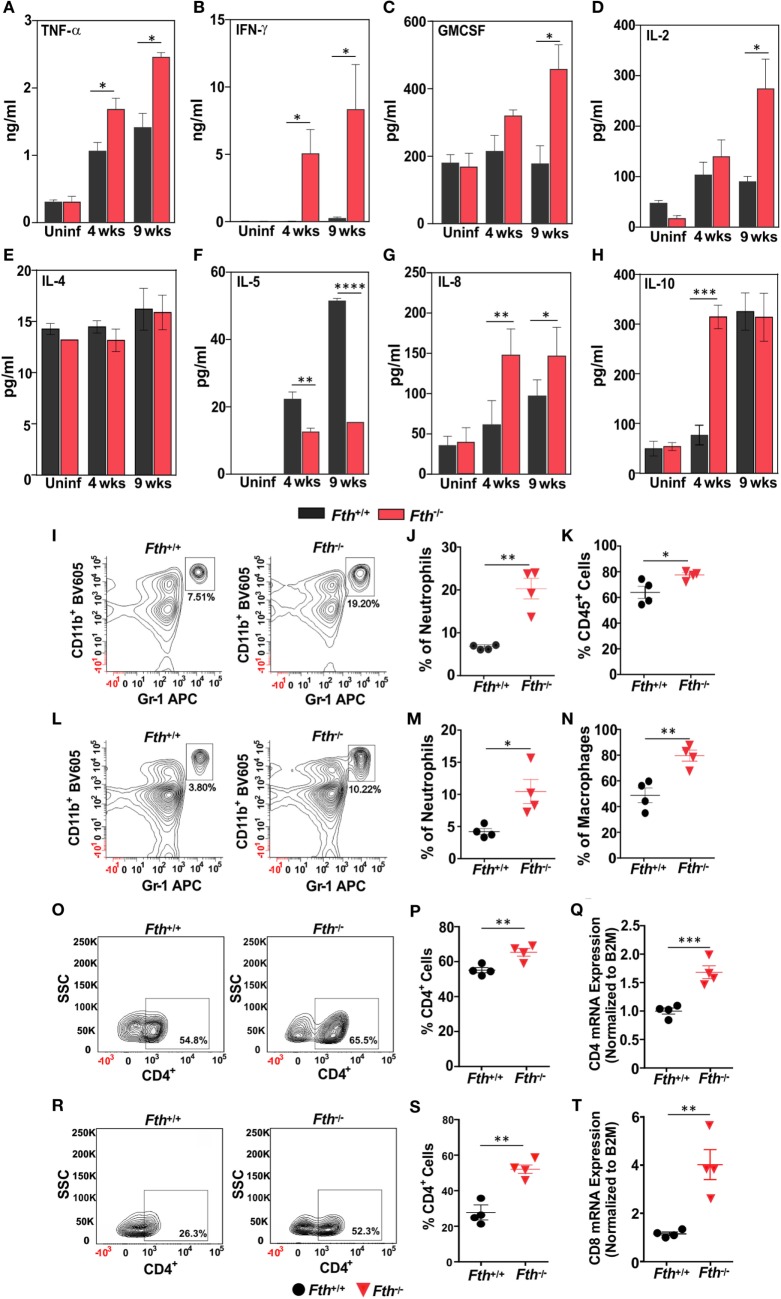
Figure 4.
Fth−/− mice elicited strong Th-1 response upon Mtb infection. (A–H) Levels of TNF-α, IFN-γ, GM-CSF, IL-2, IL-4, IL-5, IL-8, and IL-10 in bronchoalveolar lavage fluid obtained from uninfected Fth+/+ and Fth−/− mice and at 4 and 9 weeks postinfection (n = 7). (I) Representative contour plots showing the percent of CD11b+/Gr-1(1A8)bright neutrophils (box) isolated from lungs 4 weeks postinfection. (J) Percentage of neutrophils in the lungs of mice at 4 weeks postinfection (n = 4). (K) Percentage of CD45+ cells in the lungs of mice at 4 weeks postinfection (n = 4). (L) Representative contour plots showing the percent of CD11b+/Gr-1(1A8)bright neutrophils (box) isolated from spleens 4 weeks postinfection. (M) Percentage of neutrophils in spleens of mice at 4 weeks postinfection (n = 4). (N) Percentage of CD11b+/ly6C+ macrophages in the spleen of mice at 4 weeks postinfection (n = 4). (O) Representative contour plots showing the percent of CD4+ cells (box) from the lungs of mice at 4 weeks postinfection. (P) Percentage of CD4+ cells in the lungs of mice at 4 weeks postinfection (n = 4). (Q) Relative expression of CD4 mRNA levels in the lungs of Fth+/+ and Fth−/− mice at 4 weeks postinfection (n = 4). Expression levels were normalized to β-2 microglobulin. (R) Representative contour plots showing percentage of CD4+ cells (box) from the spleens of mice at 4 weeks postinfection. (S) Percentage of CD4+ cells in the spleens of mice at 4 weeks postinfection (n = 4). (T) Relative expression of CD8 mRNA levels in the lungs of Fth+/+ and Fth−/− mice at 4 weeks postinfection (n = 4). Expression levels were normalized to β-2 microglobulin. Statistical testing was performed using the unpaired Student’s t-test. Data are represented as mean ± SEM (*p < 0.05, **p < 0.01, ***p < 0.001, ****p < 0.0001).

