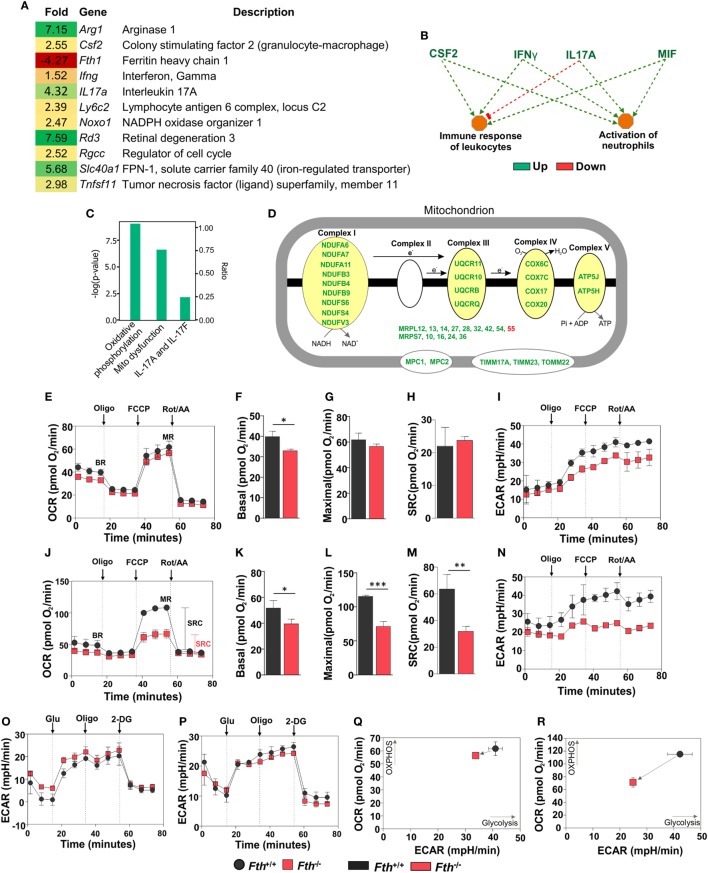
Figure 5.
Gene expression analysis of lungs from Mtb-infected mice. (A) Heat map showing differentially regulated genes in the lungs of Fth−/− mice compared to wild-type mice at 9 weeks postinfection (n = 3). (B) Ingenuity pathway analysis (IPA) showing how upregulation of immunomodulators in Fth−/− mice affect immune functions. (C) IPA shows that pathways involved in oxidative phosphorylation, mitochondrial dysregulation, and the IL-17 family are altered in Fth−/− mice at 9 weeks postinfection. (D) IPA shows that pathways involved in the electron transport chain are altered in Fth−/− mice at 9 weeks postinfection. Bioenergetic analysis of peritoneal macrophages from Fth+/+ and Fth−/− mice infected with Mtb. (E) Oxygen consumption rate (OCR) of uninfected peritoneal macrophages from Fth+/+ and Fth−/− mice. (F–H) Basal respiration, maximal respiration (MR), and spare respiratory capacity (SRC) of uninfected macrophages. (I) Extracellular acidification rate (ECAR) of uninfected peritoneal macrophages from Fth+/+ and Fth−/− mice. (J) OCR of Mtb-infected peritoneal macrophages at 24 h postinfection. (K–M) Basal respiration, MR, and SRC of Mtb-infected macrophages. (N) ECAR of Mtb-infected peritoneal macrophages at 24 h postinfection. (O) ECAR of uninfected macrophages using glycolytic stress test. (P) ECAR of Mtb-infected macrophages using glycolytic stress test. (Q) Phenogram (OCR Vs ECAR) of uninfected macrophages. (R) Phenogram (OCR Vs ECAR) of Mtb-infected macrophages. Data in panel (A) represents the mean fold change of three mice with q < 0.05 and cutoff ±1.5-fold. Statistical testing was performed using the unpaired Student’s t-test. Data are represented as mean ± SEM of three independent experiments (*p < 0.05, **p < 0.01, ***p < 0.001).

