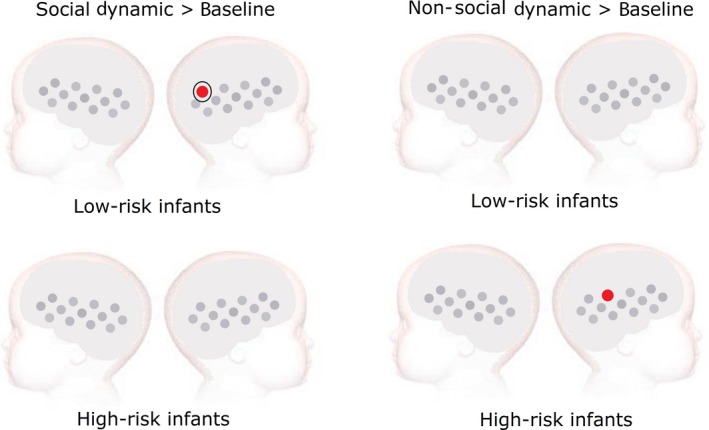
Figure 3.

Results of the analysis comparing cortical activation to dynamic social (left) and non‐social stimuli (right) with respect to the non‐social static baseline. Low‐risk infants (upper panels) showed increased HbO2 concentration changes for the social dynamic stimuli in channel 25. High‐risk infants (lower panels) showed increased HbO2 concentration changes for the non‐social dynamic stimuli in channel 22. Significant group differences were found in channel 25, indicated by the black circle.
