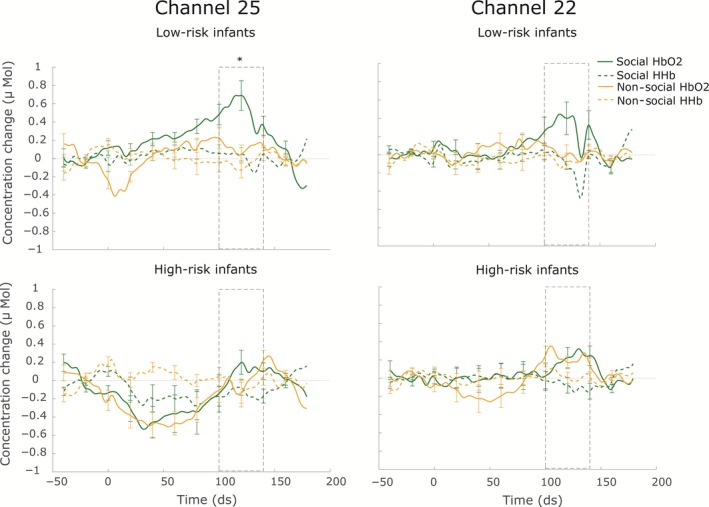
Figure 4.

Averaged Haemoglobin concentration changes for the social and non‐social dynamic condition for the low‐risk (LR, upper panels) and high‐risk (HR, lower panels) infants in channel 25 (left) and 22 (right). Time point 0 represents the onset of the dynamic video block, and the dotted window shows the time window on which the statistical comparisons are based. Group differences are indicated by the asterisk.
