
Figure 3.
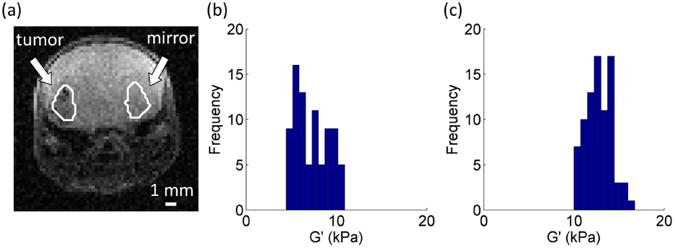
(a) Manually delineated tumor and mirror ROIs. Histogram of the G′ values of the (b) tumor and (c) mirror ROIs from Figure 2a. The number of bins for each histogram was calculated as the square root of the total number of voxels for each delineated region. A total of 9 bins were used to group the 82 voxels in the contoured tumor and mirror regions.