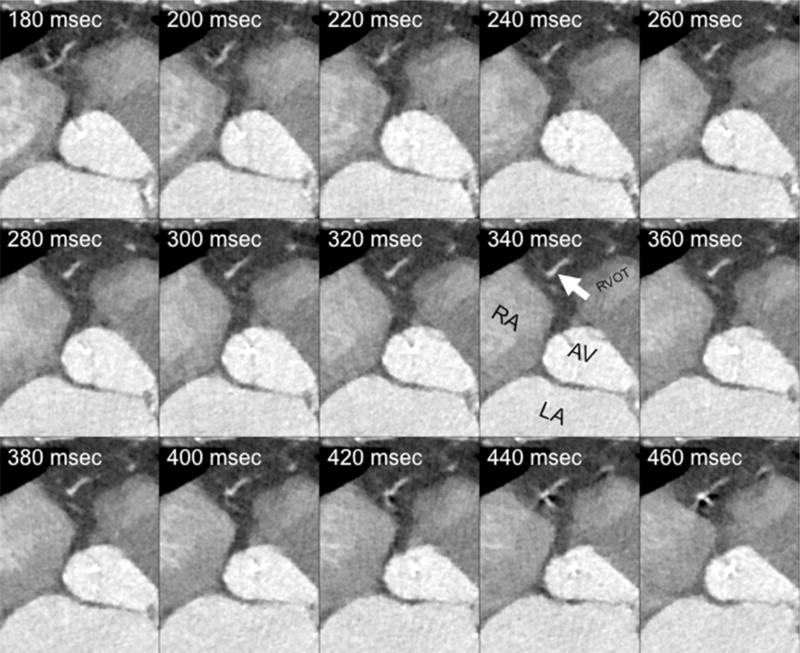
Fig. 1.
Raw data sets reconstructions in 20 ms increments after R peak with 1 mm thick slices. Mulitple axial reconstructions of the right heart during systole (absolute delays after the R-wave from 180 ms through 460 ms in 20 ms increments) demonstrate the optimal phase time of 340 ms at the level of an acute marginal branch (white arrow). The right atrium (RA), left atrium (LA), aortic valve (AV), and right ventricular outflow tract (RVOT) are marked

