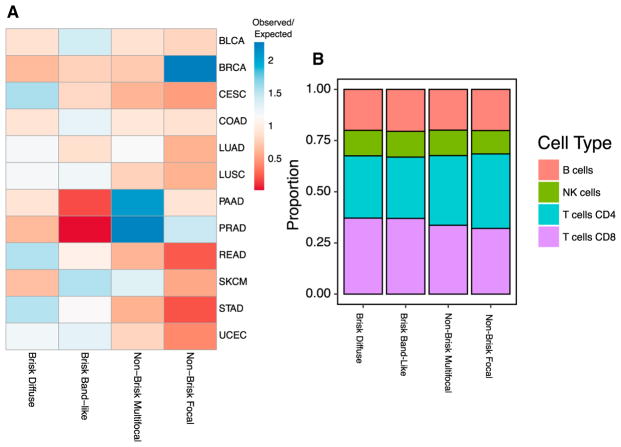
Figure 7. Association of Spatial Structural Patterns with Tumor Type and Cell Fractions.
(A) Each row corresponds to one of four spatial structure patterns, assigned in a manner consistent with the descriptions currently used to characterize the nature of the immune infiltrate in standard histopathological examinations, and each column is a TCGA tumor types. The values shown are the sample count for each tumor type and spatial structure pattern, divided by the counts expected by chance. The ratio of observed to expected co-membership counts is shown on a color scale, where the largest ratios are in red, values near unity as yellow, and blue represents fewer than expected counts.
(B) Estimates of the proportion of CD4, CD8, NK cells, and B cells were segregated by spatial structure patterns and averaged. Bars show the proportion within each structural pattern. These proportions are estimated using molecular data of the TCGA. See also Figure S5.

