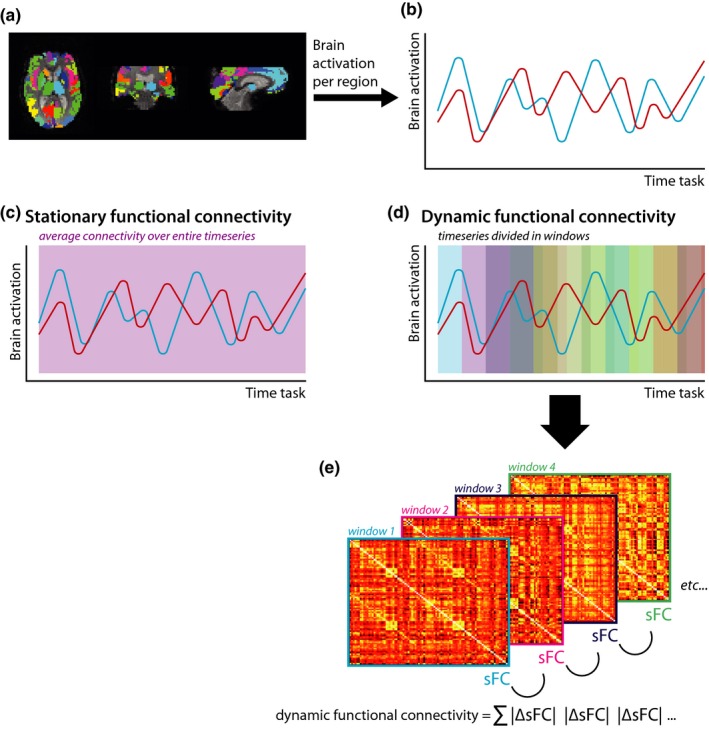
Figure 1.

Schematic overview of stationary and dynamic functional connectivity analysis pipeline. For each cortical and subcortical brain region (a), the mean time series were obtained (b). Stationary functional connectivity was calculated over the entire time series (c), while for dFC the time series were divided into sliding windows (d). For each sliding window, the stationary functional connectivity was calculated, and subsequently, the absolute difference between each consecutive window was calculated and summed as a measure for dFC (e). sFC, stationary functional connectivity; dFC, dynamic functional connectivity
