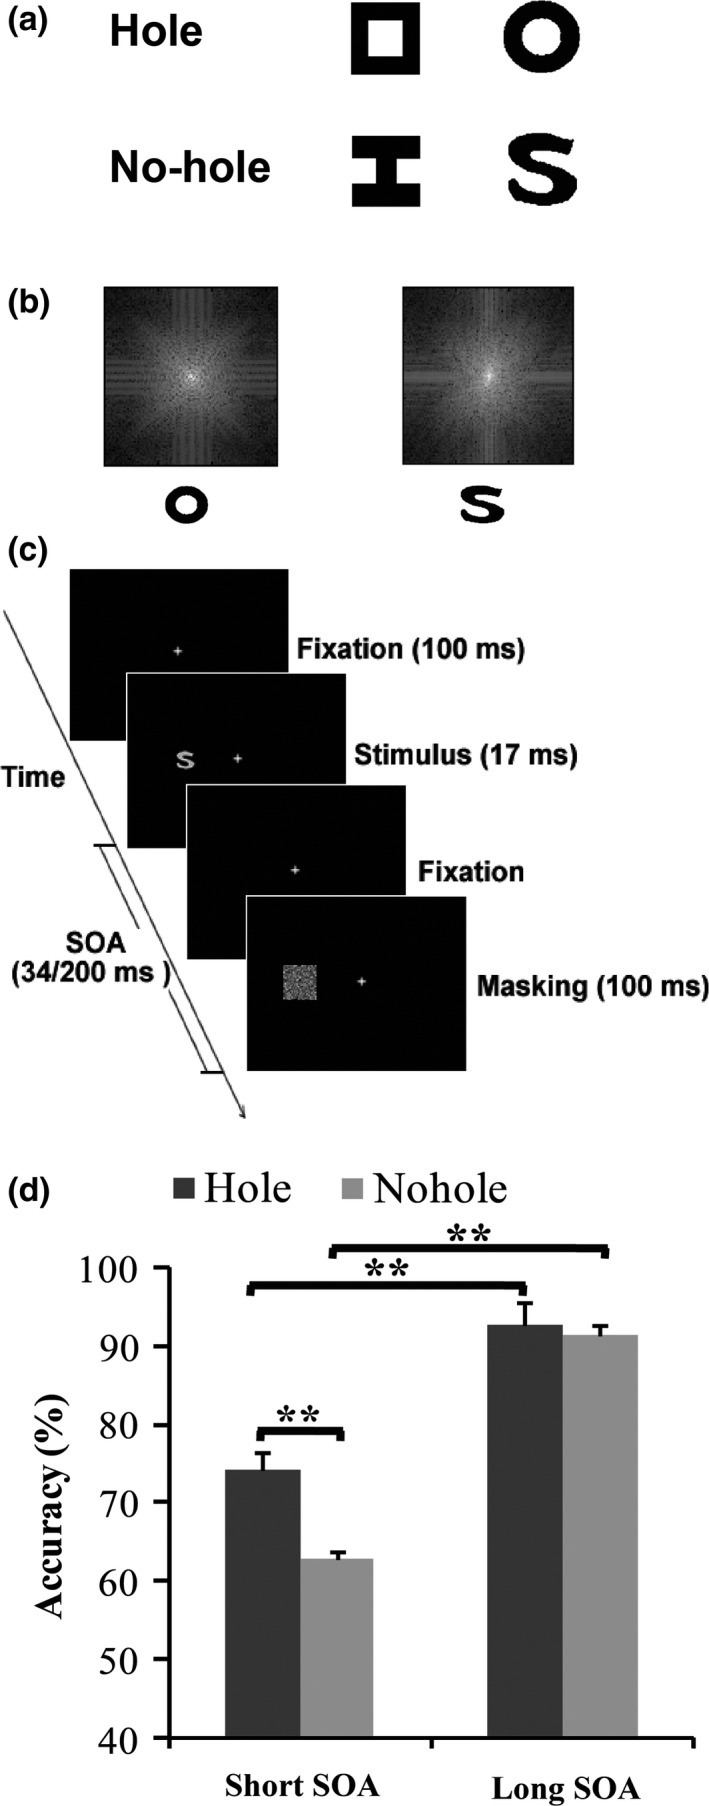
Figure 1.

(a) Schematic depiction of the stimulus pairs used as target stimuli. (b) The power spectra (2D Fourier transformation) of the ring versus the S. (c) Schematic illustration of the visual task in the fMRI experiments. (d) Mean discrimination performance of the hole stimulus and no‐hole stimulus in long and short SOA conditions. Error bars indicate the standard error of the mean (SEM). **p < .01. fMRI, functional magnetic resonance imaging; SOA, stimulus onset asynchrony
