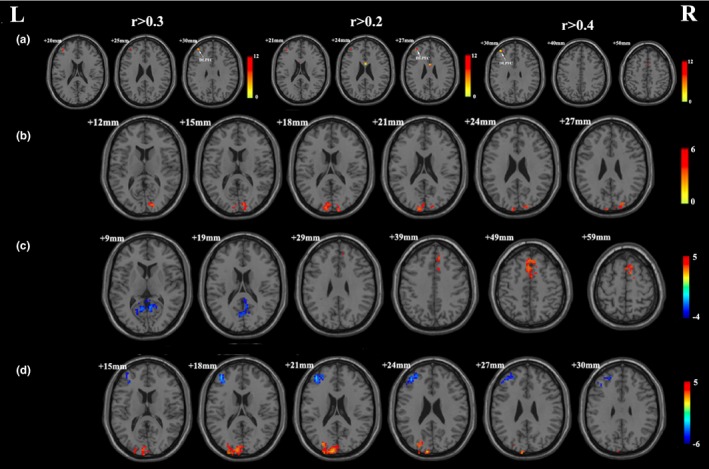
Figure 2.

(a) Significant group × time interactions on degree centrality with 0.3, 0.2, and 0.4 as correlation threshold respectively. (b) Significant effect of time on degree centrality. (c) Brain regions showing significant difference in degree centrality between OCD patients and the healthy controls at baseline. (d) Brain regions showing significant difference in degree centrality in OCD patients following CBT. L, left side; R, right side. The threshold was a voxel p‐value <.001, a cluster p‐value <.05, two‐tailed (GRF correction) for a and b; and voxel p‐value <.05, a cluster p‐value <.05, two‐tailed (GRF correction) for c and d
