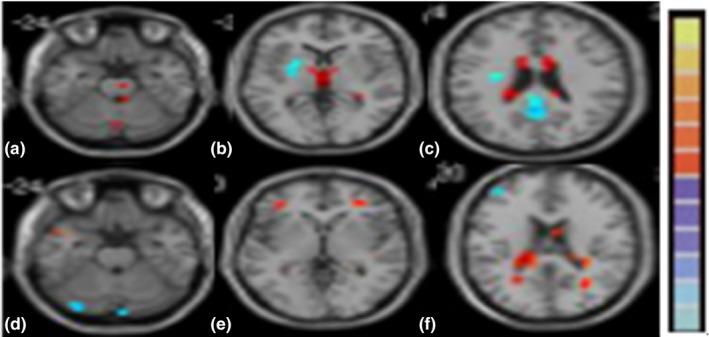
Figure 3.

rs‐fMRI results of ROIs in the brains of patients with WD. Blue signals show the lower ALFF values (a–c) or REHO values (d–f), while red signals show higher ALFF values or REHO values compared with normal controls. ALFF values of the TH (b), REHO values of the TH on the two hemisphere differed (e). Abbreviations: TH, thalamus; ALFF, amplitude of low‐frequency fluctuation; REHO, regional homogeneity; ROI, regions of interest; WD, Wilson's disease
