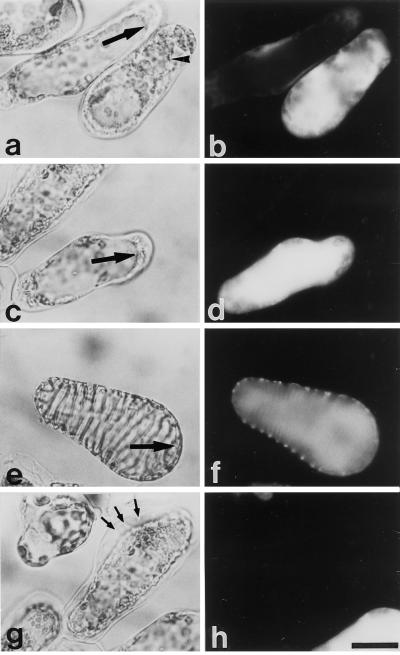
Figure 8.
Tonoplast disintegration of cells treated with probenecid. Light (a, c, e, and g) and fluorescence (b, d, f, and h) micrographs of zinnia cells. Non-TE cells that were treated with 100 μm probenecid for 6 h after 55 h of culture (a–d) were stained with FDA for 1 h. Large arrows point to the tonoplast (a, c, and f). The arrowhead indicates the fragmented, spherical vacuole formed after the disruption of the central vacuole (a). TEs incubated with FDA for 1 h (e and f) lost their tonoplast selective permeability without any drastic changes in the boundary between the cytoplasm and the vacuole (large arrow). Dead non-TE cells and differentiating TE cells killed by 100 μm probenecid (g and h) did not autolyze their contents. Small arrows indicate the slightly thickened secondary wall of a very young TE cell killed by probenecid. The bar indicates 20 μm.

