Figure 6.
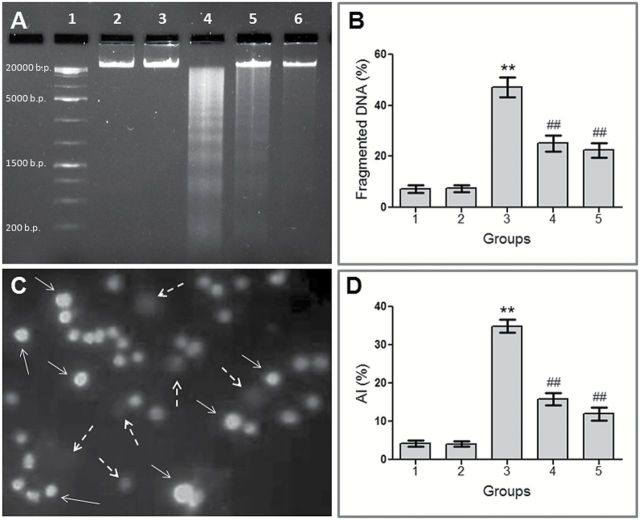
VC-III reduced CDDP-induced DNA fragmentation and apoptosis in bone marrow niche. (A) Agarose gel electrophoresis of mouse bone marrow genomic DNA. Lane 1: 1kb DNA ladder; lane 2: Group 1; lane 3: Group 2; lane 4: Group 3; lane 5: Group 4; lane 6: Group 5. (C) Representative photomicrograph of TUNEL assay performed in bone marrow cells, × 200 magnification. Apoptotic cells (TUNEL label cells) are indicated by white arrows whereas non-apoptotic cells are indicated by white broken arrows. To the right, histograms show quantification of (B) DNA fragmentation (%) and (D) apoptotic index (%) in mice bone marrow cells after CDDP administration. Data were represented as mean ± SD, n = 6. **Significantly (P < 0.001) different from Group 1 and ##significantly (P < 0.001) different from Group 3.

