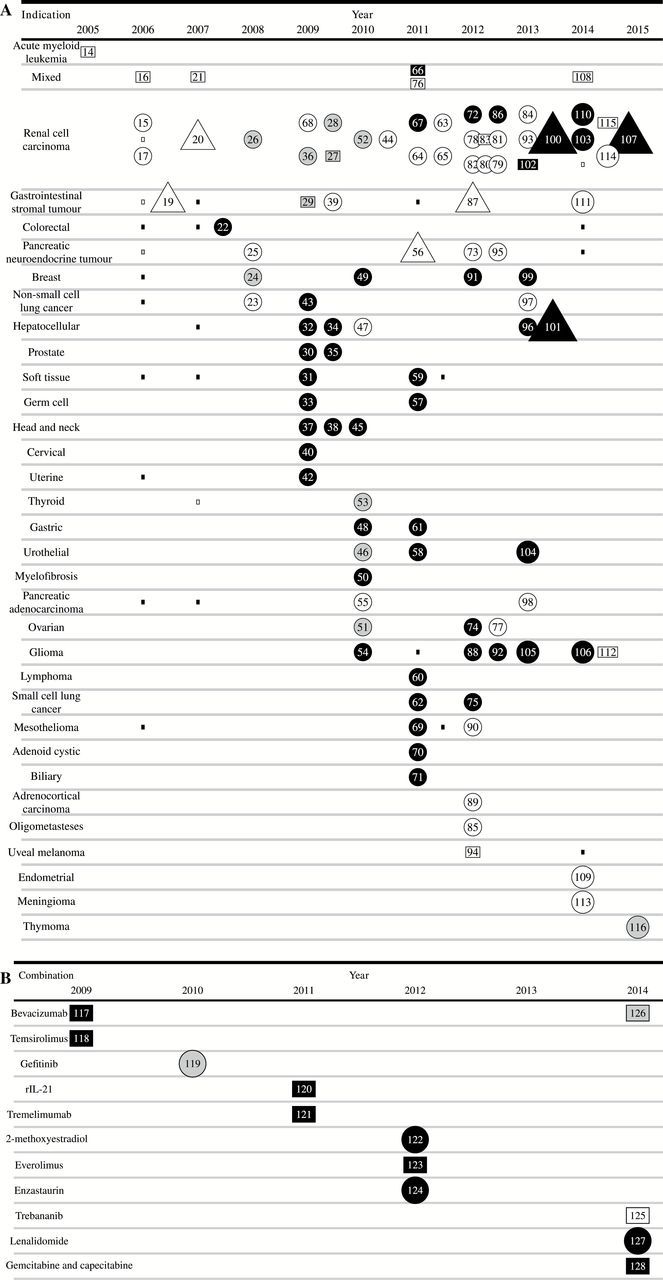
Figure 2.

Accumulating Evidence and Research Organization (AERO) graphs for sunitinib therapy. A) monotherapy stratified by indication. Nodes represent all available sunitinib cancer trials testing anticancer activity, arranged according to first publication date horizontally and stratified by indication. Larger square nodes are phase 1 trials in the designated indication. Small squares represent presence of patients with a particular indication in a “mixed malignancy” phase 1 trial. Circular nodes are phase 2 trials. Triangles are phase 3 trials. White nodes indicate acceptable toxicity and positive effect, gray represents inconclusive results, and black nodes indicate negative results for their prespecified primary endpoint. Number of nodes may not sum to figures represented in Table 1 because of different classificatory schema used in AERO graph. B) AERO graph for sunitinib combination therapy. Nodes represent sunitinib cancer trials, stratified by combination therapy, arranged according to publication year. Number of nodes may not sum to data in Table 1 because of different classificatory schema used in AERO graph.
