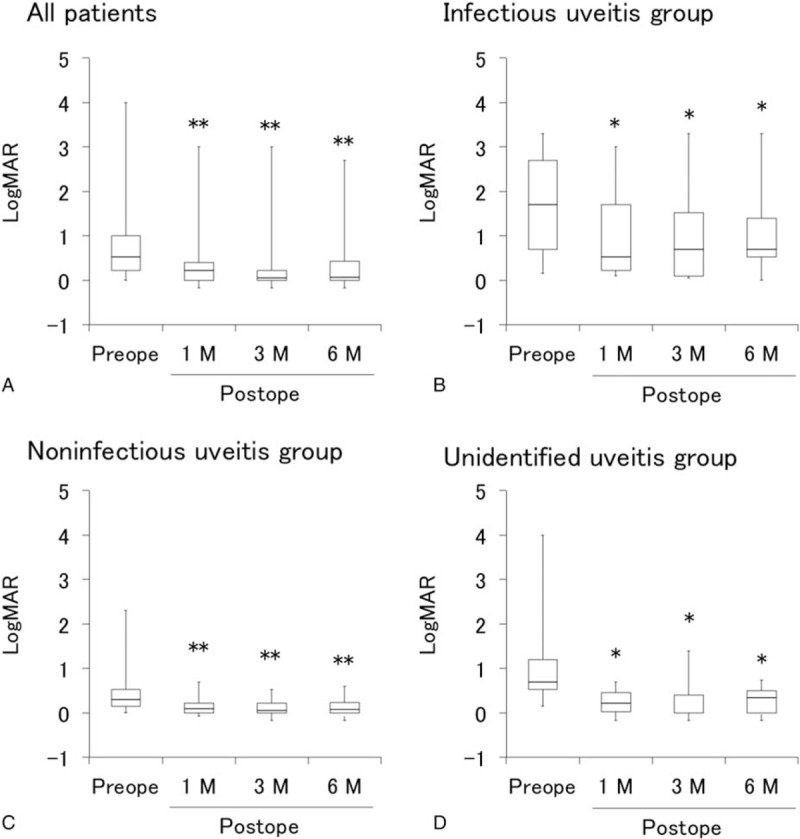
Figure 2.

Visual acuity before and after vitrectomy in uveitis with different etiologies. Box plots of logMAR before vitrectomy and at 1, 3, and 6 months after vitrectomy in all patients (A), infectious uveitis group (B), noninfectious uveitis group (C), and unidentified uveitis group (D). ∗P < .05, ∗∗P < .005 by Wilcoxon signed-rank test. LogMAR = logarithm of minimum angle of resolution.
