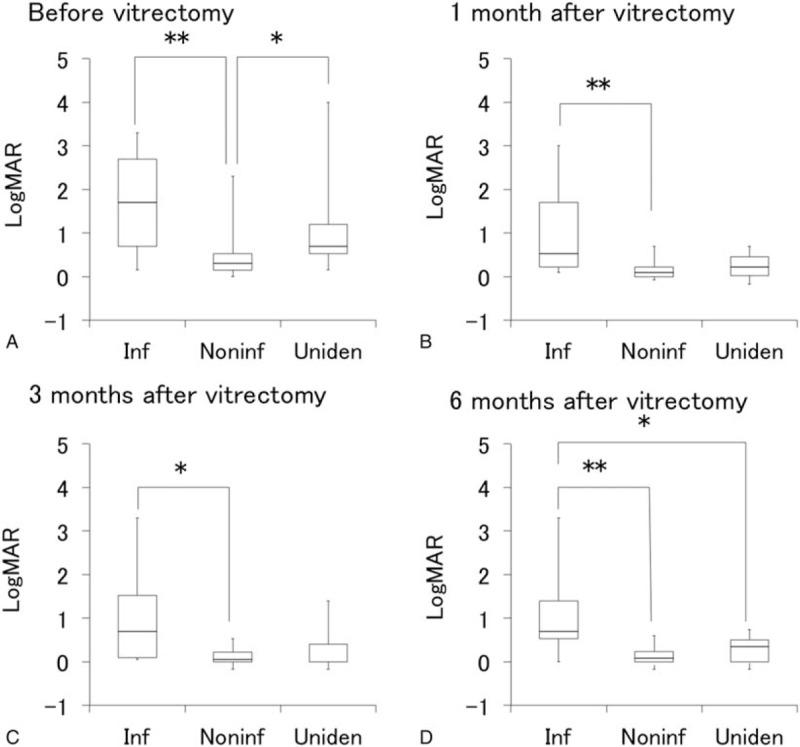
Figure 4.

Comparison of visual acuity before and after vitrectomy among uveitis with different etiologies. Box plots of logMAR in infectious uveitis group (Inf), noninfectious uveitis group (Noninf), and unidentified uveitis group (Uniden) before vitrectomy (A) and at 1 month (B), 3 months (C), and 6 months (D) after vitrectomy. ∗P < .05, ∗∗P < .005 by Steel-Dwass multiple comparison test. LogMAR = logarithm of minimum angle of resolution.
