Figure 4.

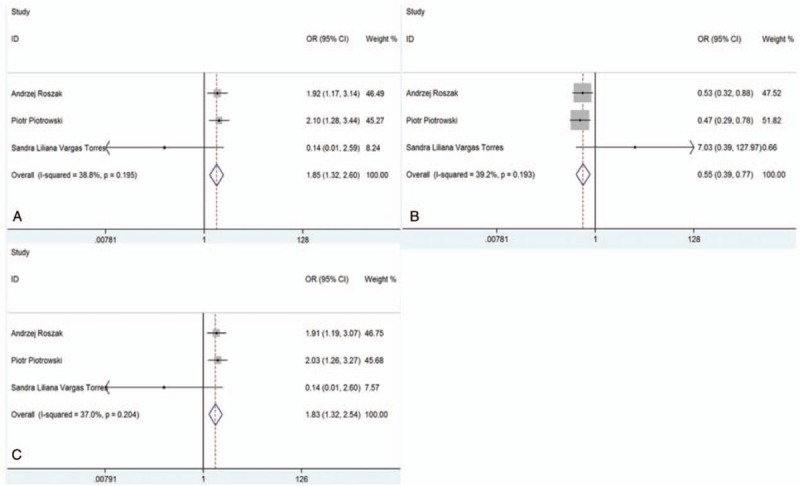
Forest plots of the association between SNP285 polymorphism and risk of gynecological cancers. (A) Model GG vs GC + CC; (B) model GC vs GG; and (C) model G vs C.

Forest plots of the association between SNP285 polymorphism and risk of gynecological cancers. (A) Model GG vs GC + CC; (B) model GC vs GG; and (C) model G vs C.