Figure 4.
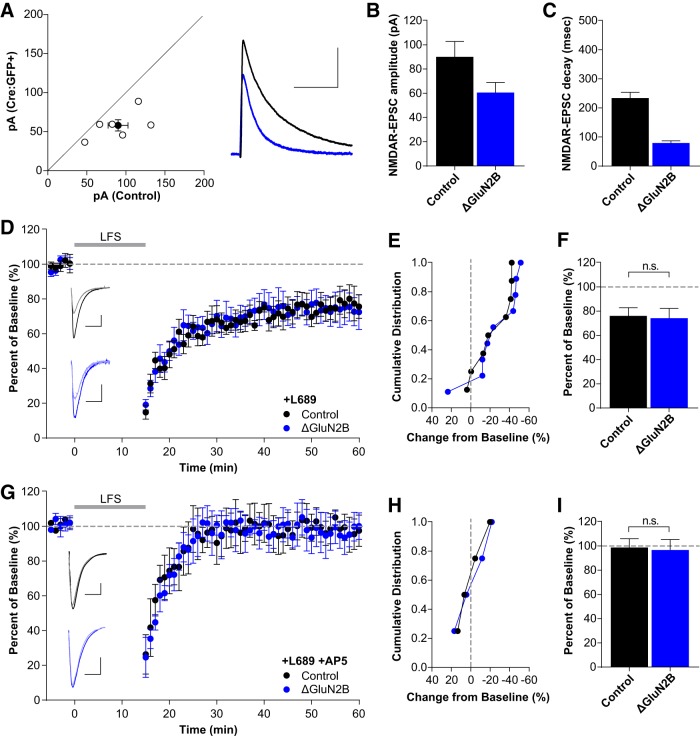
Single-neuron deletion of GluN2B does not prevent non-ionotropic LTD. A–C, Single-neuron deletion of GluN2B. A, Scatterplot of individual neuron pairs (open circles) and averaged pair ± SEM (solid circle). Sample trace scale bars indicate (100 ms, 40 pA). B, Average NMDAR-EPSC amplitudes for control (90.1 ± 12.8 pA, n = 6) and Cre:GFP+ neurons (58.1 ± 7.2 pA, n = 6); p = 0.016. C, GluN2A deletion results in significantly faster decay kinetics (control: 233.7 ± 8.2 ms, Cre:GFP+: 79.0 ± 2.9 ms; p < 0.0001). D–F, GluN2B deletion does not block LTD. D, Averaged whole-cell LTD experiments and representative traces (10 ms, 50 pA). E, Cumulative distribution of experiments in D. F, Average percentage depression relative to baseline; control neurons (76.1 ± 6.8%, n = 8), Cre:GFP+ neurons (ΔGluN2B: 74.3 ± 8.1%, n = 9; t(15) = 0.1662, p = 0.870, t test). G–I, LTD after GluN2B deletion is still blocked by AP5. G, Averaged whole-cell LTD experiments and representative traces (10 ms, 50 pA). H, Cumulative distribution of experiments in G. I, Summary graph of average percentage depression relative to baseline; control neurons (98.8 ± 7.3%, n = 4), Cre:GFP+ neurons (ΔGluN2B: 96.9 ± 8.6%, n = 4; t(6) = 0.1717, p = 0.869, t test).

